Groundspeed V₁: A Wind Shear Decision-Support Framework for Takeoff Rejection
Carlos Bousono
Technical Director, Masterpilots — Orlando, FL, USA
Contents
- 1. Introduction
- 1.1. Problem context
- 1.2. The V1 decision framework under certification
- 1.3. The wind shear decision gap
- 2. Literature review
- 2.1. Related work
- 2.2. Contribution
- 3. Theoretical model
- 3.1. Energy and stopping distance
- 3.2. Groundspeed availability and instrument lag
- 3.3. GSV1 derivation: the core formula
- 3.4. Coupled and decoupled physics
- 4. Operational decision framework
- 4.1. Exact method: operator-provided GSV1
- 4.2. Simplified method: conservative heuristic
- 4.3. Density effects and worked examples
- 4.4. Altitude effects
- 4.5. Proposed SOP integration
- 5. Case application: winter departure scenario
- 5.1. Exact calculation
- 5.2. Simplified method
- 5.3. Resolution
- 6. Implementation and constraints
- 6.1. Mandatory prerequisites
- 6.2. Contaminated runways and braking considerations
- 6.3. Risk of Design-induced Missed Abort (RDMA)
- 6.4. Regulatory and approval framework
- 6.5. SOP integration examples
- 6.6. Implementation roadmap
- 7. Validation pathway
- 7.1. Phase 1: flight-data analysis
- 7.2. Phase 2: simulator studies
- 7.3. Phase 3: operational validation
- 8. Discussion
- 9. Conclusions
- References
Highlights
- Provides quantitative takeoff abort threshold where only subjective judgment existed
- Closes the wind shear decision gap with a groundspeed-based V₁ abort gate
- Mental-arithmetic method approximates GSV₁ within a conservative margin
- Designed to require no new hardware; uses existing cockpit groundspeed displays
- Standardized PF/PM callouts counter takeoff plan-continuation bias
Graphical Abstract
 Click to enlarge
Abstract
When wind shear causes indicated airspeed (IAS) to stagnate during the takeoff roll, the certificated decision speed (V1) may no longer provide an adequate real-time stopping cue because the IAS–energy relationship assumed during performance computation is disturbed. Crews are left to make high-stakes abort-or-continue decisions in seconds, relying on subjective judgment without a quantitative reference. This paper starts from a simple but operationally neglected principle—airspeed governs whether the aircraft can fly; groundspeed governs whether it can stop—and derives a framework for expressing the certificated V1 energy state in ground-referenced terms (GSV1). The primary contribution is an exact calculation suitable for electronic flight bag (EFB) integration; for interim use we also provide a conservative mental-arithmetic heuristic. The framework requires no new hardware—only groundspeed displays already present in all transport-category aircraft—and includes standardized pilot flying (PF)/pilot monitoring (PM) callouts designed to counter plan-continuation bias.
We map implementation pathways through existing regulatory channels and outline a three-phase validation program comprising flight operations quality assurance (FOQA) analysis, simulator evaluation, and operational trials.
1. Introduction
1.1. Problem context
Low-level wind shear has been a causal factor in some of the most severe takeoff and landing accidents in commercial aviation, with more than 1,400 worldwide fatalities since 1943 (McCarthy et al., 2022). National Transportation Safety Board (NTSB) investigations of catastrophic accidents — Eastern 66 at JFK (NTSB, 1976), Pan Am 759 at New Orleans (NTSB, 1983), Delta 191 at Dallas/Fort Worth (NTSB, 1986) — prompted the Joint Airport Weather Studies (JAWS) field campaigns (McCarthy, Wilson, and Fujita, 1982) and Fujita’s’s (1985) characterization of the microburst phenomenon, which in turn drove the development of ground-based Low-Level Windshear Alert Systems (LLWAS), airborne Predictive Wind Shear (PWS) systems, and crew training programs that have greatly reduced the risk (Evans and Ducot, 1994).
Yet hazardous encounters persist. The National Oceanic and Atmospheric Administration (NOAA) Storm Events Database lists 914 microburst reports in the United States between 2000 and 2020 (Romanic, Taszarek, and Brooks, 2022), with only 5–15 seconds typically available for recognition and response per the Federal Aviation Administration (FAA, 1988). In many cases the first observable symptom is not an alert but abnormally slow airspeed increase (“airspeed stagnation”).
Modern transport-category aircraft may carry two complementary wind shear protection systems: a predictive system, which uses weather-radar Doppler processing to detect shear ahead of the aircraft (Airbus, 2015), and a reactive system, which compares inertial and aerodynamic data to identify an actual shear encounter in progress. Neither system, however, provides continuous coverage during the takeoff ground roll. On the A320 family, predictive alerts are inhibited above 100 knots (kt) and up to 50 feet (ft) radio altitude, while reactive detection activates only 3 seconds after liftoff (Airbus, 2019).
On the Boeing 737, new predictive caution alerts are inhibited between 80 kt and 400 ft radio altitude, new warning alerts between 100 kt and 50 ft radio altitude, and ground proximity warning system (GPWS)-based reactive detection begins at rotation (Boeing, 2018). Many regional jets and older transport aircraft lack predictive wind shear capability entirely.
The result is a detection gap during the highest-energy portion of the ground roll — the regime between 80–100 kt and V1 — in which crews have no automated warning and must rely on their own recognition of airspeed stagnation.
This recognition task is itself challenging. Indicated airspeed responds to pressure changes with a finite lag—0.3–1.0 s depending on installation, as characterized by Gracey (1980) and Houck and McIntyre (1998)—so a rapidly evolving shear may briefly mask the onset of performance loss. Section 3.2 examines this latency in detail.
The approach and landing phases, which the International Civil Aviation Organization (ICAO, 2005) identifies as historically accounting for the majority of wind-shear-related accidents, benefit from predictive and reactive alerts, stabilized energy states, and established go-around options explicitly trained for wind shear recovery.
In contrast, the takeoff roll offers no comparable safety net: the aircraft operates near maximum weight with rapidly increasing kinetic energy within a narrowing distance margin, leaving the pilot with no quantitative ground-referenced cue for the abort decision. IAS remains a reliable measure of aerodynamic capability—it correctly indicates whether the aircraft can fly—but during wind shear it ceases to reflect the ground-referenced energy state that governs stopping distance.
1.2. The V1 decision framework under certification
Under 14 Code of Federal Regulations (CFR) §25.107 (FAA, 2025a) and European Union Aviation Safety Agency (EASA) Certification Specifications (CS) 25.107 (EASA, 2023a), V1 is both the maximum speed at which the pilot can stop within the accelerate-stop distance available (ASDA) and the minimum speed at which takeoff can continue following critical engine failure. The V1 computation integrates ASDA, takeoff distance available (TODA), aircraft mass, atmospheric conditions (density ratio σ), runway condition, wind component, slope, configuration, and obstacle clearance; the result satisfies all regulatory constraints including minimum control speed on ground (VMCG), maximum brake energy speed (VMBE), and tire-speed limits.
Accelerate-stop calculations include a two-second pilot reaction interval reflecting real-world variability (FAA, 1998).
Standard operating procedures (SOPs) typically structure rejected-takeoff decisions around defined speed regimes: below an operator-defined transition speed—commonly 80 kt for Boeing fleets and 100 kt for Airbus fleets—crews are trained to reject for any condition affecting safe flight; above that transition speed and up to V1 (the high-energy regime), crews reject only for critical conditions such as engine failure, fire, wind shear, or when the aircraft is unsafe or unable to fly; above V1, the expectation is to continue unless the aircraft is clearly incapable of flight.
This doctrine reflects the central trade-off between the risk of a high-speed rejected takeoff (potential runway excursion, tire or brake failure, or loss of separation) and the risk of continued takeoff with degraded capability. The V1 speed represents the optimum balance point under certification assumptions: below V1, stopping is guaranteed within available runway; above V1, continuing with engine failure is feasible.
1.3. The wind shear decision gap
During a wind shear encounter, indicated airspeed remains a valid measurement of dynamic pressure; what changes is that the assumptions embedded in the precomputed V1 may no longer be satisfied. When IAS stagnates despite sustained takeoff thrust, the crew’s primary speed reference decouples from the aircraft’s kinetic energy state: groundspeed—and therefore stopping energy—continues to increase while the airspeed indication flatlines.
The aerodynamic capability (governed by dynamic pressure and IAS) remains as designed, but the ground-referenced energy state—which determines stopping distance—diverges from what the crew observes on the airspeed tape.
The preflight V1 as an operational decision boundary becomes unreliable not because IAS is false, but because the performance basis for V1 has been violated by the wind-shear-altered airflow. The pilot is looking at valid instruments that no longer tell the whole truth.
ICAO and major manufacturers have recognized the decision-making challenges associated with this condition. Airbus acknowledges that when wind shear is detected during the takeoff roll, “the pilot may have to rely on his/her own judgment to assess if there is sufficient runway remaining to stop the aircraft” (Airbus, 2015). ICAO notes that “the go/no-go criteria based on engine-failure decision speed (V1) may not be valid for wind shear conditions, since ground speed can be much higher than airspeed” (ICAO, 2005).
National Aeronautics and Space Administration (NASA) analysis found that “attainment of V1 in a wind shear condition does not necessarily assure that the aircraft can be safely stopped on the runway” (Zweifel, 1988). Yet despite these acknowledgments, neither ICAO guidance documents nor manufacturer flight crew operating manuals provide a specific quantitative method for crews to express V1 in ground-referenced terms when IAS becomes stagnated due to atmospheric phenomena.
Human factors research underscores the consequences of decision ambiguity. In a NASA-sponsored think-aloud study, Fischer, Orasanu, and Davison (2008) presented 61 airline pilots with conflicting wind shear pilot reports before departure: 73.7 % chose to depart despite the reported shear. The finding illustrates not recklessness but interpretive variability—pilots who saw the same cues reached opposite conclusions about the level of threat.
Separately, analysis of hull-loss accidents found that plan-continuation errors accounted for roughly three quarters of tactical decision failures, predominantly during approach and landing where cues were ambiguous and workload was high (Orasanu and Davison, 2001). The takeoff-roll wind shear scenario shares these same characteristics—ambiguous cues, high workload, and no quantitative threshold—suggesting that a pre-briefed GSV₁ gate could reduce interpretive variability. Whether it does so in practice is an empirical question addressed by the simulator studies proposed in Section 7.2.
2. Literature review
2.1. Related work
Several related research streams have addressed aspects of wind shear detection, takeoff performance monitoring, and optimal escape trajectories. None, however, has proposed a crew-usable, pre-briefable groundspeed decision threshold for the takeoff abort/continue decision during IAS stagnation. A systematic review of the most relevant prior work establishes this gap.
Wind shear detection and performance monitoring. Foy (1981) first evaluated groundspeed–airspeed differences as a shear indicator for approach operations. Proctor, Hinton, and Bowles (2000) developed the F-factor hazard index—now the FAA-certified standard for onboard reactive detection—which quantifies instantaneous energy loss rate. These systems detect shear presence but do not provide a crew decision threshold for the abort/continue choice. NASA’s takeoff performance monitoring system (TOPMS) (Middleton, Srivatsan, and Person, 1994) used GPS-derived groundspeed for real-time GO/ABORT advisories based on acceleration monitoring; it addressed deficiency detection rather than wind shear specifically and was not adopted by manufacturers.
A subsequent EUROCAE working group (WG-94) on takeoff performance monitoring system (TOPMS) standardization was unable to define performance requirements, partly due to technology maturity and the persistent false-alarm/workload trade-off (EASA, 2025b): a monitor that triggers unnecessary high-speed rejects can itself increase risk (EASA, 2025b). Jones (2019) proposed a Takeoff Performance Indicator (TOPI) concept using real-time wind component, but it requires hardware integration and does not derive the groundspeed–V1 relationship from Part 25 physics. More recently, EASA (2025b) has proposed requiring takeoff performance monitoring systems on large aeroplanes under Notice of Proposed Amendment (NPA) 2025-01 (RMT.0741).
The proposal documents Airbus’s certified Take-Off Monitoring (TOM) function, operational on A350 and A380 fleets, which compares expected and actual acceleration from 30 kt and alerts crews at 90 kt if degradation exceeds 15%. Boeing and Embraer are developing equivalent functions. These acceleration monitoring systems detect data-entry errors, position errors, and engine degradation but do not address the IAS–groundspeed energy divergence specific to wind shear during the takeoff roll.
Trajectory optimization and stopping-distance analysis. Miele, Wang, and Melvin (1986) established theoretical performance limits for microburst encounters through variational methods; Stratton and Stengel (1995) developed a Bayesian risk-fusion system for wind shear avoidance. Neither produced a crew-briefable threshold. Zweifel (1990) conducted the only published simulation of stopping distance during takeoff-roll wind shear (Boeing 727, five surfaces), confirming shear magnitude as the dominant factor but not deriving a crew decision criterion. Gonzalez and Lombaerts (2023) analyzed V1 sensitivity to environmental conditions without addressing IAS stagnation.
Notably, groundspeed-based speed protection already exists in another flight phase: Airbus’s Groundspeed Mini function uses ground-referenced speed to set a minimum selectable approach speed, and is accepted by regulators (Airbus, 2015). No analogous function exists for the takeoff roll.
Accident investigations and recent developments. Investigation reports consistently document the gap. The Air Accidents Investigation Branch (AAIB) East Midlands investigation (AAIB, 2020) found the manufacturer’s response emphasized pilot judgment with no quantitative thresholds; the Australian Transport Safety Bureau (ATSB) Perth investigation (2013) documented a crew that continued and cleared the runway end at 10 ft radio altitude. The Flight Safety Foundation (FSF, 2017) documented a case where IAS stopped increasing for several seconds with no alerts recorded.
While onboard detection remains limited, ground-based wind shear sensing has advanced considerably: coherent Doppler light detection and ranging (LIDAR) systems now provide airport-area coverage, as demonstrated by Chan (2012) and Zhang et al. (2022), and machine-learning severity classifiers applied to LIDAR data have achieved detection probabilities above 90%, notably in the work of Hon (2020) and Khattak et al. (2024). These systems improve situational awareness before takeoff but do not assist the crew once the roll has begun.
More broadly, Van Es (2010) found that about 50% of high-speed rejected-takeoff decisions across all causes were judged incorrect in hindsight, underscoring the difficulty of time-critical abort decisions even when cues are unambiguous. The wind shear scenario compounds this difficulty by removing the crew’s primary quantitative reference. Yet no published work provides a crew-briefable groundspeed threshold for the takeoff abort decision during IAS stagnation.
2.2. Contribution
Table 1 summarizes the approaches reviewed above and identifies, for each, the specific gap that remains. A common pattern emerges: existing systems and guidance either detect wind shear without providing an abort criterion, or address acceleration deficiency rather than the IAS–groundspeed energy divergence that characterizes a wind shear encounter during the takeoff roll.
Table 1: Literature gap analysis: existing approaches and the gap addressed by this paper.
The operational significance of this gap becomes apparent when the FAA’s severe-wind-shear threshold of 15 kt airspeed change (FAA, 1988) is expressed in time. Near V1, average ground-roll acceleration computed from the Daidzic (2016) energy-balance model ranges from approximately 2.7 kt/s for a heavy widebody at reduced thrust to over 6 kt/s for a lighter narrowbody at full takeoff thrust (Fig. 1), so a 15-kt IAS stagnation takes roughly 2.5–6 seconds to develop. That interval is comparable to the time required for human recognition of unexpected instrument anomalies (Wickens, 2002), and falls within the detection-gap window during which automated alerts are inhibited (Section 1.1).
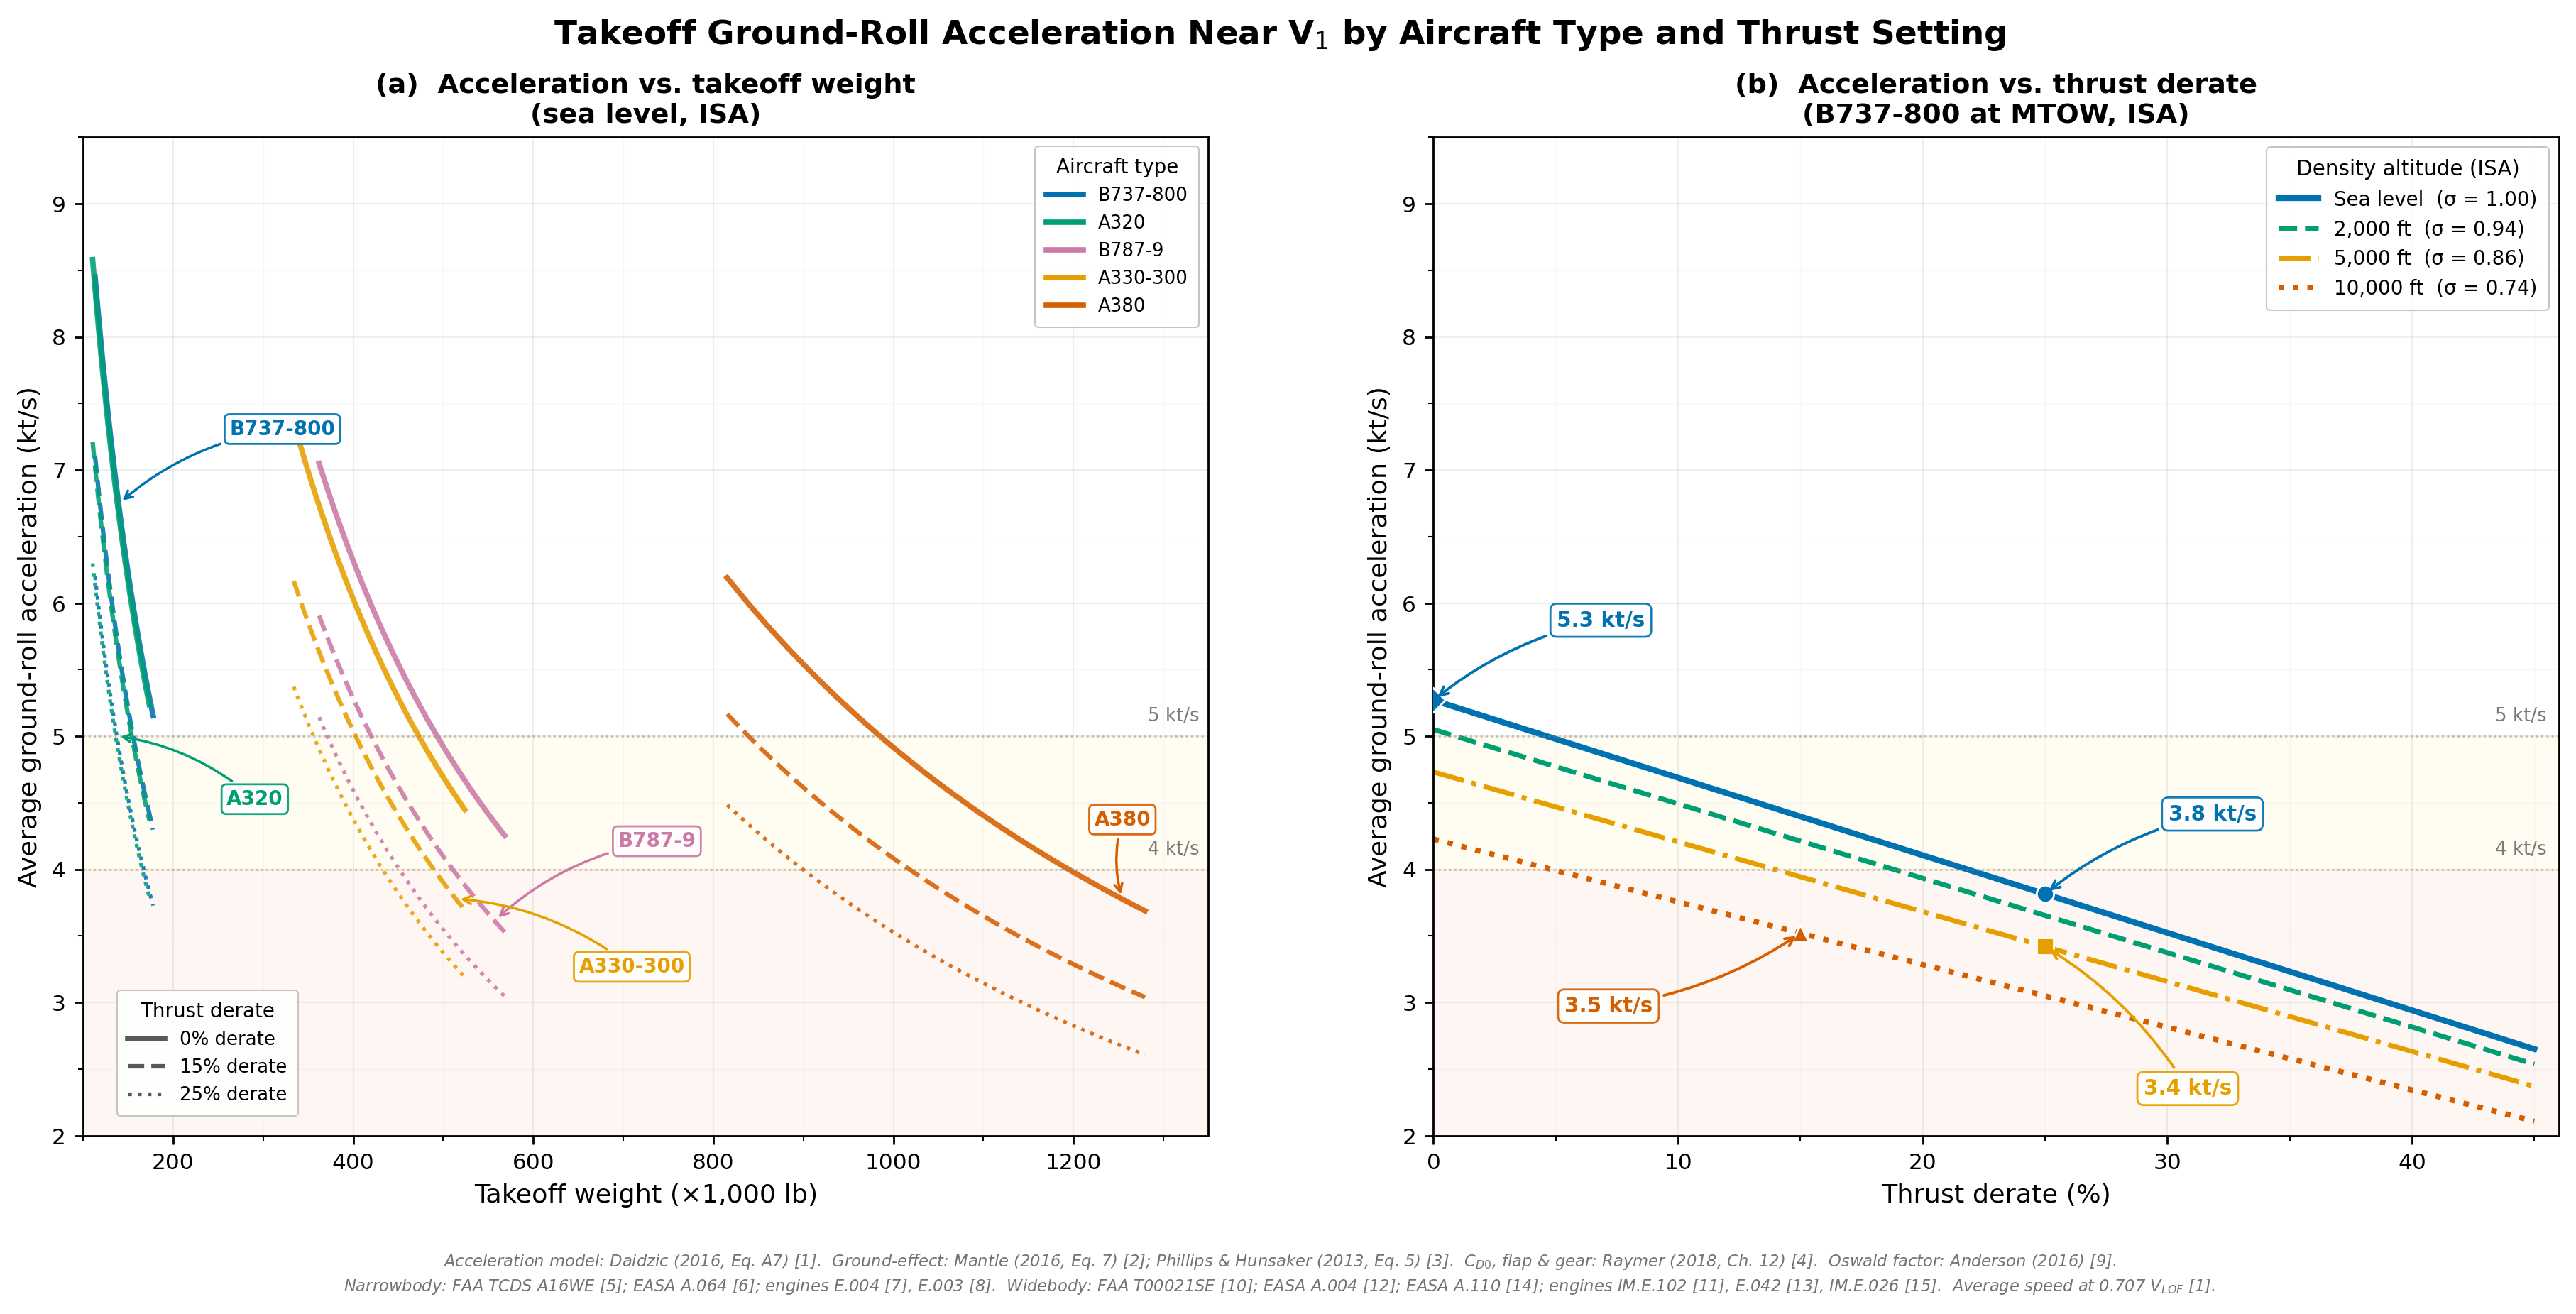 Click to enlarge
Figure 1. Average all-engines-operative acceleration near V₁ for representative narrowbody (B737-800, A320) and widebody (B787-9, A330-300, A380-800) types computed from the Daidzic (2016) energy-balance model (Eq. A7). Left: acceleration versus takeoff weight at sea level ISA for 0 %, 15 %, and 25 % thrust derate. Right: acceleration versus thrust derate for B737-800 at maximum takeoff weight (MTOW) across four density altitudes. Ground-effect drag polar uses the Prandtl–Wieselsberger influence coefficient (Mantle, 2016), zero-lift and incremental drag build-up (Raymer, 2018), and Oswald-based induced-drag formulation (Anderson, 2016) with the Phillips and Hunsaker (2013) span-efficiency correction. B737-800 airframe data from FAA type certificate data sheet (TCDS) A16WE (2024); A320 from EASA TCDS A.064 (2025); CFM56-7B27 from EASA TCDS E.004 (2024); CFM56-5B4 from EASA TCDS E.003 (2024). B787-9 from FAA TCDS T00021SE (2024); A330-300 from EASA TCDS A.004 (2024); A380-800 from EASA TCDS A.110 (2023); GEnx-1B74 from EASA TCDS IM.E.102 (2024); Trent 772B-60 from EASA TCDS E.042 (2024); GP7270 from EASA TCDS IM.E.026 (2024).
Once wind shear is recognized, the critical question is whether the aircraft can stop given its current ground-referenced energy state. The existing framework offers no quantitative answer during IAS stagnation, because the conventional V1 cue has ceased to track the aircraft’s true kinetic energy relative to the runway.
This paper makes three contributions. First, we derive a physics-based method for expressing the certificated V₁ energy state in ground-referenced terms (Section 3). Second, we operationalize it through standardized crew procedures and a conservative interim heuristic (Section 4). Third, we map an implementation pathway through existing regulatory channels (Section 6) and outline a validation program as a prerequisite for operational adoption (Section 7).
3. Theoretical model
The physical model rests on standard aerodynamic and Newtonian mechanics as treated by Anderson (2016) and Hurt (1965). The underlying physics—how indicated airspeed, true airspeed, and groundspeed relate to the energy states governing stopping performance—are elementary. What has been missing is a systematic way to apply them at the operational level during wind shear.
The derivation intentionally employs closed-form equations suitable for operational use. The simplifications involved, and the reason they do not compromise the method, are addressed after the core result is derived (Section 3.1).
3.1. Energy and stopping distance
The kinetic energy at the reject-decision point may be written in integral form as:
where the integral represents the incremental work required to accelerate the aircraft of mass m from rest to groundspeed V₀. This energy must be dissipated to bring the aircraft to a complete stop on the runway. Wheel brakes dissipate this energy primarily through friction work at the tire–runway interface:
where μ(λ,V) is the slip-controlled tire friction coefficient as a function of slip ratio λ and velocity V, W is weight, L(V) is residual lift (decreasing with speed as dynamic pressure decreases), and s is the stopping distance. For closed-form analysis, consistent with the equivalent-deceleration approach used in certified accelerate–stop performance, an effective friction coefficient μeff is adopted. This coefficient represents the time-averaged deceleration capability and incorporates the complex dynamics of tire slip control, lift effects, and aerodynamic drag:
Here, μeff represents the certified equivalent deceleration used in transport accelerate–stop performance, incorporating antiskid modulation, lift dump, speed-dependent drag, and reverse thrust effects. Equating initial kinetic energy to braking work and solving for stopping distance:
Thus, stopping distance increases with the square of groundspeed and decreases with effective runway friction. This relationship exists entirely in the Earth-fixed frame, reinforcing that during wind-shear-induced IAS stagnation, the correct reference for stopping feasibility is governed by ground-referenced kinetic energy, not indicated airspeed.
The quadratic dependence on groundspeed matters: a 10% increase in groundspeed (e.g., from 140 kt to 154 kt) produces a 21% increase in required stopping distance.
A reasonable objection is that the closed-form model is too simple—real rejected takeoff (RTO) performance includes speed-dependent aerodynamic drag, residual lift effects, thrust reverser contribution, brake-temperature limits, and runway slope.
The GSV₁ method does not need to model these individually because the certificated V₁ already accounts for them. The method simply expresses that certificated energy state in groundspeed terms, preserving all the fidelity and safety margins already embedded in the manufacturer’s performance data.
A separate question is whether wind shear persisting after the reject decision could invalidate the certified stop margin. The effect is small, because wheel braking—not aerodynamic drag—dominates the ground roll. The force decomposition in the FAA Takeoff Safety Training Aid (Boeing, 1992) quantifies this: for a representative twin-engine transport at approximately 124 kt with speedbrakes deployed and no thrust reversers, wheel brakes account for approximately 87% of total retarding force, with aerodynamic drag contributing the remaining 13%.
Certified dry-runway accelerate–stop distances already exclude reverse thrust credit per 14 CFR §25.109(f)(1), so the only air-mass-sensitive force in the certified stop is aerodynamic drag—the 13% component. The 87% contributed by wheel braking is ground-referenced and largely unaffected by post-reject wind variations.
To verify this robustness quantitatively and assess its sensitivity to wind shear, we construct a first-principles deceleration model for a B737-800 at maximum takeoff weight on a dry runway with ground spoilers deployed and no reverse thrust—the same conditions specified in the Boeing (1992) training aid. Wheel braking force is computed as Fbrake = μB(W − L), using the Daidzic (2016) effective braking coefficient (μB = 0.305, Eq. 5), which incorporates tire–surface friction, brake effort, anti-skid efficiency, and effective weight transfer. Aerodynamic drag is derived from a speed-dependent drag polar (Raymer, 2018) with ground-effect correction using the Prandtl–Wieselsberger influence coefficient (Mantle, 2016). Wind shear is modeled as a sustained tailwind shift—the most conservative assumption, as it maximizes the reduction in aerodynamic forces throughout the entire ground roll.
Under zero wind, the model predicts that wheel braking contributes 86.7% of total retarding force at 124 kt, closely matching the 87% derived from force data in the Boeing (1992) training aid. Introducing a 60-kt sustained tailwind reduces total deceleration by only 7.1%, adding approximately 171 ft (52 m) to the stopping distance at V₁ = 150 kt. The additional distance, while not negligible on a balanced field, falls within the conservatism already embedded in the certificated accelerate–stop distance: no reverse-thrust credit (14 CFR §25.109), a two-second recognition time, and conservative tire–surface friction assumptions. Moreover, when wind shear is forecast, operational practice adds further margin through longer runway selection, weight restrictions, and conservative wind assumptions in the takeoff performance computation.
 Click to enlarge
Figure 2. Deceleration force decomposition for a B737-800 at maximum takeoff weight (70,307 kg) on a dry runway with ground spoilers deployed and no reverse thrust. (a) Total deceleration force versus groundspeed under zero wind (shaded fill: blue = wheel braking, orange = aerodynamic drag); colored lines show total deceleration under 20-, 40-, and 60-kt sustained tailwind shifts. Inset bar chart compares the braking and drag contributions at 124 kt. (b) Wheel-braking fraction of total deceleration versus groundspeed: under zero wind (solid blue) and under 20-, 40-, and 60-kt tailwind shifts (dashed lines). The star marks the Boeing (1992) validation point (87% at 124 kt). Braking coefficient μB = 0.305 from Daidzic (2016, Eq. 5); drag polar from Raymer (2018) with Prandtl–Wieselsberger ground-effect correction (Mantle, 2016) and Oswald-based induced drag (Anderson, 2016); airframe data from FAA TCDS A16WE (2024).
3.2. Groundspeed availability and instrument lag
Groundspeed is available from two independent onboard sources: Inertial Reference Systems (IRS), integrating inertial measurements relative to Earth, and Global Navigation Satellite Systems (GNSS), determining velocity from satellite-based solutions (Grewal et al., 2001). Both are independent of air-mass motion. Modern transport-category aircraft carry redundant IRS units (typically two or three), and GNSS/IRS fusion provides an accurate combined estimate.
For indicated airspeed, three sources of delay accumulate in series: pneumatic propagation through pitot-static tubing, approximately 0.3 s for conventional tubing (Gracey, 1980); digital filtering in the air data computer (ADC), 0.4–0.7 s (Houck and McIntyre, 1998); and Aeronautical Radio, Incorporated (ARINC) 429 bus transmission, 50–125 ms (Thommen, 2016). For conventional installations these components sum to approximately 0.75–1.13 s. Smart-probe architectures (integrated pitot-static sensors with on-board processing) largely eliminate the pneumatic propagation delay, reducing the lower bound to approximately 0.45 s.
The combined IAS probe-to-display latency therefore ranges from 0.45 s (smart probe) to approximately 1.0 s (conventional tubing with optimized filtering) for current transport-category installations.
For groundspeed, the signal chain is entirely different. IRS units compute velocity by integrating accelerometer measurements at 50 Hz (Honeywell, 2016), independent of air-mass dynamics; flight-test measurements show a total transport delay of approximately 80 ms (NCAR, 2023). GNSS receivers independently determine velocity from Doppler shift with ≤0.2 m/s (≈0.4 kt) accuracy at the 95 % confidence level (U.S. DoD, 2020). The combined IRS groundspeed path reaches the cockpit within approximately 0.16 s (Fig. 3, Table 2).
 Click to enlarge
Figure 3. Comparative probe-to-display latency for indicated airspeed (IAS) and groundspeed (GS) systems across four representative architectures. The IAS signal chain includes pneumatic tubing lag (Gracey, 1980), ADC digital filtering (Houck and McIntyre, 1998), and ARINC 429 bus transmission; total latency ranges from 0.45 s (smart probe with optimized filter) to 0.98 s (traditional tubing with prior-art filter). The IRS groundspeed path eliminates the pneumatic component entirely, achieving a total latency of approximately 0.16 s (NCAR, 2023). The differential lag |ΔL| ≈ 0.29 s yields a speed-reading difference of approximately 1 kt at typical takeoff acceleration rates.
For small lags and slowly varying signals, the display error may be approximated by the product of the lag and the signal’s rate of change (Gracey, 1980). The only additional factor for maintaining equivalence when substituting groundspeed for IAS is the differential display latency:
where GṠ is the rate of change of groundspeed and ΔL = LGS − LIAS is the differential lag between the two systems. Near V1 during normal takeoff acceleration, the Daidzic (2016) energy-balance model gives GṠ ≈ 4 kt/s for a typical reduced-thrust narrowbody departure at maximum takeoff weight. As characterized above, the IRS groundspeed path (≈ 0.16 s) is faster than even the best-case IAS path (≈ 0.45 s for a smart-probe installation), giving a minimum differential |ΔL| ≈ 0.29 s:
This represents the most conservative comparison—the smallest IAS latency against typical IRS latency. For conventional pitot-static installations (IAS latency ≈ 0.75–1.0 s), the differential grows to 0.59–0.84 s and the corresponding speed-reading difference increases to approximately 2.4–3.4 kt. In all cases, groundspeed leads IAS; the GS advantage only increases with longer IAS latencies.
The two-second distance margin in §25.109 already accounts for operational variability in pilot stopping-action times (FAA, 1998); using groundspeed with a comparable or lower latency introduces no additional uncertainty beyond what is already accommodated.
The analysis above applies to the dominant case: IRS-primary groundspeed, for which no lag correction is required. Aircraft equipped with attitude and heading reference system (AHRS) rather than full IRS (principally regional turboprops and business jets; FAA, 2014) typically derive groundspeed from a 1 Hz GNSS receiver, creating a latency of approximately 1.0 s—comparable to the worst-case IAS path. For these installations, a speed correction GSV1(use) = GSV1 − GṠ · ΔLmax should be applied; at GṠ ≈ 4 kt/s and ΔLmax ≈ 0.5 s, this amounts to approximately 2 kt.
For IRS-primary or GNSS/IRS-fused installations (Honeywell, 2016), the minimum differential lag is |ΔL| ≈ 0.29 s (smart-probe IAS), with conventional installations showing up to ≈ 0.84 s. Even in the conventional case the resulting speed-reading difference remains below 3.5 kt (Eq. 5), well within the two-second margin of §25.109; no correction is necessary. If groundspeed indications are invalid or unavailable, crews shall revert to existing manufacturer wind shear guidance.
Table 2: Representative latencies for transport-category speed indication systems.
3.3. GSV1 derivation: the core formula
V1 is computed and delivered as a calibrated airspeed. To use groundspeed as a decision criterion during wind shear stagnation, the CAS-based V1 must be mapped to the equivalent groundspeed for the same atmospheric state. The translation rests on two relationships: the correction from CAS to true airspeed (TAS) via compressibility and density-ratio corrections, and the addition of the runway-parallel wind component to obtain groundspeed.
 Click to enlarge
Figure 4. Vector relationship between true airspeed, groundspeed, and wind. The aircraft's motion relative to the air mass (true airspeed) combines vectorially with wind to produce motion relative to the runway surface (groundspeed). Since stopping distance is governed by ground-referenced kinetic energy, groundspeed—not indicated airspeed—governs the aircraft's ability to stop within the available runway length.
The scalar quantities GS, TAS, and W∥ used in the equations that follow are the runway-parallel components of the vectors shown in Fig. 4. The relationship between true airspeed and equivalent airspeed follows from density correction:
where equivalent airspeed (EAS) is calibrated airspeed (CAS) corrected for compressibility: EAS = CAS − Δcomp. Compressibility effects become measurable only above Mach 0.3; at typical takeoff speeds (M ≈ 0.15–0.25), the correction is less than 1 kt. At V1:
Groundspeed differs from true airspeed by the runway-parallel wind component W∥, defined as positive for a tailwind and negative for a headwind:
Hence:
At typical V1 speeds (M ≈ 0.15–0.25), the compressibility correction is less than 1 kt—an order of magnitude smaller than the two-second pilot reaction margin embedded in V1. For operational use, this term may be omitted. The exact isentropic relation between calibrated airspeed (CAS) and true airspeed (TAS) used in operational performance tools reflects standard pitot–static compressible flow equations. At typical takeoff speeds, simplified density corrections suffice. Thus, for operational use:
The density ratio σ is computed from field conditions:
where p₀ = 1013.25 hectopascals (hPa), T₀ = 288.15 K. Static pressure at field elevation h (standard atmosphere):
Combining all terms:
3.4. Coupled and decoupled physics
Aircraft takeoff performance depends on two physically distinct reference frames: aerodynamic capability (air-relative) and stopping capability (ground-relative). Indicated airspeed governs aerodynamic capability through dynamic pressure:
Thus, IAS is the direct instrument proxy for the dynamic pressure that determines lift coefficient, stall margin, and aerodynamic controllability. Groundspeed governs stopping capability: braking energy E = ½mV²GS makes stopping distance proportional to the square of groundspeed. Because IAS and GS are linked through a fixed density ratio and the instantaneous wind component, a single IAS-based V1 serves as a reliable proxy for both aerodynamic capability and ground-referenced stopping performance.
 Click to enlarge
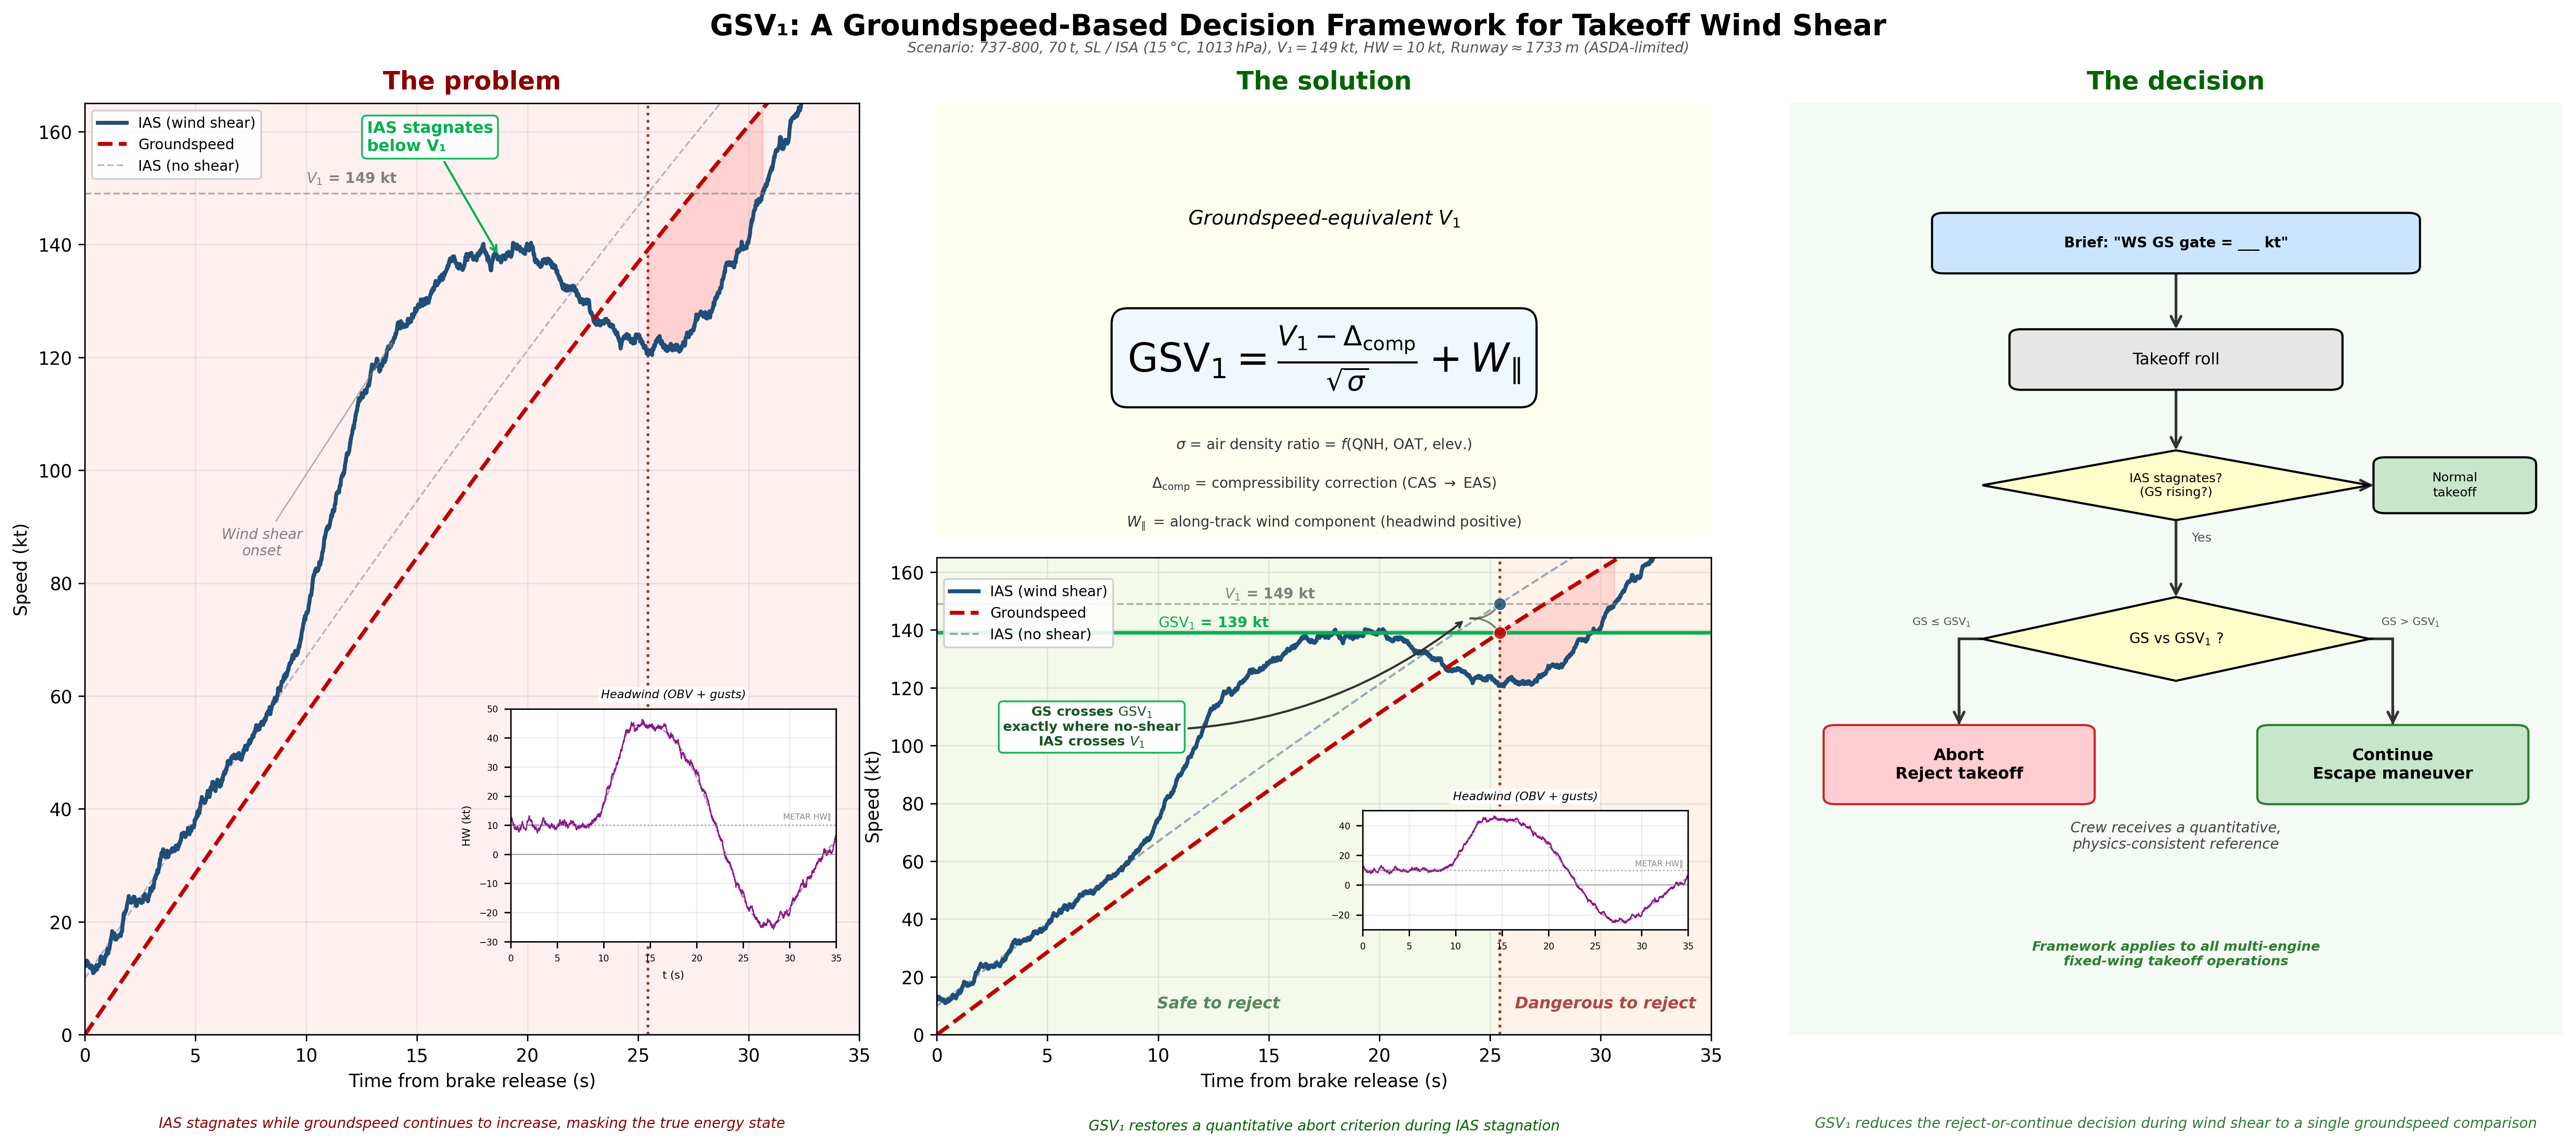
Figure 5. IAS versus groundspeed divergence during wind shear. Simulated B737-800 takeoff at 70,000 kg, full rated takeoff thrust (TOGA), sea level ISA, V1 = 149 KIAS, initial 10-kt headwind. Left: normal conditions with IAS and groundspeed tracking in parallel, offset by the steady headwind. Right: severe microburst encounter modeled using the Oseguera–Bowles–Vicroy (OBV) analytical wind field, originally developed by Oseguera and Bowles (1988) and refined by Vicroy (1992), with the Li et al. (2012) nonlinear boundary-layer correction. IAS stagnates near 139 kt while groundspeed crosses the GSV1 gate at 139 kt, revealing an energy state invisible to airspeed instruments. The shaded band between GSV1 (exact) and GSV1 (simplified) shows the bounded conservatism of the k-factor method. Gust turbulence is superimposed on both wind scenarios to reflect realistic surface-layer variability. Insets show the along-track wind profile (purple: instantaneous with gusts; orange dashed: mean). The lower subplot strips display the horizontal F-factor per Proctor et al. (2000), computed as F = −(dW∥/dt)/g, where W∥ is the along-track wind component and g is gravitational acceleration (FAA, 2018). The F-factor is derived from the mean (gust-free) wind field and smoothed with a 0.5-second uniform moving average to suppress numerical differentiation artifacts, analogous to the low-pass filtering applied by onboard reactive systems to isolate sustained shear from turbulence noise. Under normal conditions (a), F remains near zero. During the microburst encounter (b), F peaks at 0.47—well above the 0.10 alert threshold used by FAA-certified reactive wind shear systems (FAA, 2018)—confirming the energy loss rate that IAS stagnation alone may not reveal in time for the abort/continue decision. Color intensity of the F-factor trace increases with |F|, transitioning from light orange (benign) through deep orange to red (hazardous).
Wind shear disrupts this coupling by rapidly altering the wind component. When a headwind collapses or reverses during the takeoff roll, IAS may stagnate while groundspeed continues to increase. The pre-computed V1 may no longer provide an adequate real-time stopping cue because the IAS–energy relationship assumed during performance computation is disturbed. The aircraft is not losing aerodynamic capability (IAS remains representative of lift and controllability), but it is gaining ground-relative energy at a rate that was not anticipated when V1 was computed.
The GSV1 gate resolves this by expressing the certificated V1 energy state in ground-referenced terms using the actual atmospheric conditions and the operator's wind policy, preserving Part 25 performance intent while providing a ground-referenced decision threshold when IAS stagnation has been identified.
Because wind shear alters the along-track wind component, the divergence between groundspeed and IAS changes rapidly during a shear encounter. Monitoring this divergence in real time, however, demands sustained crew attention under extreme time pressure. GSV1 distils the decision into a single pre-computed gate: if the groundspeed reaches a known threshold while IAS has stagnated, the energy state has exceeded the certificated stopping envelope regardless of how the wind is behaving at that instant.
The certificated V1 may be limited by maximum brake energy (VMBE), tire speed ratings, or field length rather than purely accelerate-stop distance. These constraints are embedded in the V1 value and are automatically preserved in GSV1. The groundspeed translation expresses existing certification limits in ground-referenced terms without bypassing any Part 25 requirement or introducing new performance calculations. The method remains conservative by design: all underlying safety margins are retained.
A special case arises when V1 is constrained by rotation speed (VR). Under 14 CFR §25.107, V1 may not exceed VR; when field length is generous relative to aircraft weight, the accelerate-stop-limited V1 would be higher than VR, so V1 is capped at VR.
In these cases, the GSV1 gate computed from the published V1 (≈ VR) is lower than the gate that would result from the unconstrained stopping-limited V1. The gate therefore triggers a “continue” indication at a groundspeed below the aircraft’s actual stopping capability—the aircraft could safely reject at a higher energy state than the gate implies. This is operationally conservative: it biases toward continuation when ample runway remains, which is the safer default during wind shear.
Operators seeking the full abort envelope may compute GSV1 from the unconstrained accelerate-stop V1 (the V1 that would apply if VR were not limiting), recovering the additional stopping margin. This refinement is straightforward in EFB tools that already carry the balanced-field and unbalanced-field V1 values, and has no effect on certification compliance because the underlying performance data are unchanged.
4. Operational decision framework
With the theoretical basis established, we now turn to operational implementation. This section translates the GSV1 derivation into pre-computable groundspeed gates that crews can brief and reference when airspeed indications stagnate due to wind shear. Two methods are presented—an exact EFB-based calculation and a simplified heuristic for interim use—followed by worked examples, density-effect analysis, and proposed SOP integration.
Historical incidents illustrate the operational reality and allow retrospective application of the GSV1 method. In February 2020, a Boeing 737-800 departing from East Midlands Airport (AAIB, 2020) during Storm Ciara—the most severe windstorm to affect England and Wales since 2014, with over 25 stations recording gusts exceeding 60 kt (Met Office, 2020)—experienced a 13-knot airspeed loss near V1 due to wind shear.
The aircraft, with a computed V1 of 134 knots indicated airspeed (KIAS), encountered significant wind shear with associated downward airspeed trend. The captain, observing the airspeed decay, elected to reject the takeoff five seconds after reaching V1, bringing the aircraft to a stop with approximately 2000 ft of runway remaining.
The rejected takeoff resulted in thermal damage to the braking system from sustained maximum braking effort. Applying the GSV1 method retrospectively using the conditions available to the crew at briefing time—previous meteorological aerodrome report (METAR) 209°/40 kt, outside air temperature (OAT) 13 °C, altimeter sub-scale setting (QNH) 981 hPa, field elevation 300 ft, σ ≈ 0.96—the exact GSV1 computes to approximately 115 kt. The simplified k-factor method yields approximately 100 kt.
The crew's groundspeed at the rejection point was approximately 148 kt—33 kt above the exact gate and 48 kt above the simplified gate—indicating that by the GSV1 criterion, the aircraft had already far exceeded its certificated V1 energy state and a continue decision would have been appropriate, consistent with the manufacturer’s subsequent guidance documented in the investigation report (AAIB, 2020).
Notably, the modeled acceleration near V1 for this 73-tonne aircraft at full takeoff thrust was approximately 5 kt/s (Fig. 6), consistent with the 4–6 kt/s range derived from the Daidzic (2016) energy-balance model (Fig. 1). The higher acceleration compresses the crew’s decision window, reinforcing the need for a pre-briefed groundspeed reference that does not depend on real-time instrument interpretation.
 Click to enlarge
Figure 6. Illustrative reconstruction of the East Midlands incident (AAIB, 2020). Panel A shows the IAS–groundspeed divergence during frontal wind shear: groundspeed (red) climbs smoothly under thrust while IAS (blue) is corrupted by the changing headwind, opening a gap that conventional V1 monitoring cannot detect. The dashed blue line shows the no-shear baseline—where IAS would have tracked under a steady headwind equal to the METAR mean (21 kt); under this condition, IAS crosses V1 at almost exactly the same moment GS crosses GSV1, confirming the energy-equivalence principle. V-speeds V1 = 134 and VR = 149 kt are marked. The GSV1 exact gate (115 kt, solid green) and simplified k-factor gate (100 kt, dotted green) were both crossed well before the rejection point. Panel B shows the along-track headwind component derived from IAS − GS, starting at approximately 38 kt (Storm Ciara gusty conditions, well above the METAR mean of 21 kt) and decreasing through the frontal shear passage to near zero at the time of the rejected takeoff, with the brief gust lull visible near t ≈ 16 s. Parameters based on published AAIB findings and the previous METAR (210°/40G56 kt, 13 °C, QNH 981); not actual flight data recorder (FDR) data.
A similar scenario with a different outcome occurred at Perth Airport (ATSB, 2013) in December 2012, where a Boeing 737-838 experienced airspeed stagnation at 134 kt for 3–4 seconds just below its V1 of 137 KIAS due to unexpected wind conditions that invalidated the nil-wind performance assumptions. The crew continued the takeoff and cleared the runway end at 10 ft radio altitude. For this event—field elevation 67 ft, OAT 37 °C, QNH standard, automatic terminal information service (ATIS) headwind 8 kt—GSV1 computes to approximately 134 kt (Fig. 7).
At the onset of IAS stagnation, the crew’s groundspeed was approximately 100 kt—well below both the exact GSV1 gate (134 kt) and the simplified gate (115 kt)—indicating that a rejection remained within the certificated stopping envelope. The crew continued without this reference, clearing the runway end at just 10 ft radio altitude—illustrating both the decision gap the framework addresses and the dangerously thin margins when wind shear is not detected early.
 Click to enlarge
Figure 7. Illustrative reconstruction of the Perth incident (ATSB, 2013). Panel A shows the IAS–groundspeed divergence during a headwind-to-tailwind reversal caused by a gust-front passage: groundspeed (red) climbs continuously under thrust while IAS (blue) stagnates near 134 kt for 3–4 seconds as the headwind collapses, opening an energy gap invisible to the crew. The GSV1 exact gate (134 kt, solid green) and simplified k-factor gate (115 kt, dotted green) are shown; GS crosses the exact gate while IAS remains below V1. The dashed blue line shows the no-shear baseline under steady ATIS headwind (8 kt). V-speeds V1 = 137 and VR = 139 KIAS are marked. Panel B shows the along-track headwind component, transitioning from an initial headwind of approximately 9 kt to a tailwind exceeding 15 kt. The aircraft departed with derated 24K thrust (firewalled to 27K during the encounter) at 66.1 tonnes on runway 06 (2163 m) and cleared the runway end at 10 ft radio altitude. Parameters based on published ATSB findings (field elevation 67 ft, OAT 37 °C, QNH standard); not actual digital flight data recorder (DFDR) data.
These retrospective analyses demonstrate that the GSV1 method would have provided the crews with objective, quantitative references precisely when wind shear compromised the IAS-based V1 framework.
4.1. Exact method: operator-provided GSV1
Ideally, operators should include GSV1 directly in takeoff performance data alongside V1,CAS. The performance calculation software already has all necessary inputs (field elevation, temperature, pressure, wind) and can provide GSV1 as an additional output with minimal modification. Alternatively, an EFB calculation tool could compute GSV1 from crew inputs using Eq. 10, which is the foundational exact definition of the gate:
An EFB implementation should evaluate the full expression including the compressibility correction Δcomp (Eq. 10). Although this correction is negligible at typical takeoff Mach numbers (less than 0.1 kt at sea-level airports, as shown in Section 3.3), it costs nothing to include in a software computation and ensures the gate remains rigorously energy-equivalent across all conditions, including high-elevation airports where the correction grows.
The simplified form (Eq. 11) is reserved for mental arithmetic and interim use without EFB support.
The wind component W∥ in Eq. 10 uses the same sign convention and value used to compute V1 (Eq. 9). Because V1 was calculated under these wind assumptions, the gate must replicate them to represent the same energy state. A headwind reduces the gate; a tailwind raises it. The result is the groundspeed at which the aircraft’s ground-referenced kinetic energy equals the V1 energy state—neither conservative nor optimistic, but energy-equivalent by construction.
If the performance data specify a required minimum headwind (e.g., “computed for 7 kt headwind minimum”), that headwind value defines W∥ for the gate calculation.
Note: The term “Groundspeed V1 Gate” is used throughout because it aligns with terminology familiar to flight crews. However, technically the gate represents an energy-equivalent V1 condition, meaning the same kinetic-energy state as the certified V1 under actual atmospheric and wind conditions.
4.2. Simplified method: conservative heuristic
Until the exact GSV1 is available in operator performance data, crews need an interim criterion that can be quickly computed and briefed. The principle is straightforward: pick a conservative groundspeed gate that is never higher than the exact value. If you reject at or below that number, you're always doing it at or below the energy the airplane was planned to handle for the original V1. A rule-of-thumb approximation is “V1 minus 10–20%” under standard and dense air conditions respectively.
This mental-arithmetic approach allows crews to brief the gate in seconds during the takeoff briefing.
where k represents 1/√σ under worst-case dense air conditions (k < 1) and Hrequired is the minimum headwind from performance data (0 if not specified). The k-factor is pre-selected based on atmospheric conditions, producing a gate that is always at or below the exact value. Wind effects are already embedded in the V1 performance computation through their influence on both takeoff acceleration and stopping distance.
Unlike the exact method, which uses the full W∥ to replicate the V1 energy state precisely, the simplified method adopts a deliberately conservative wind policy: only performance-required headwind is subtracted, and tailwind is not added. When V1 was computed with tailwind, the published V1,CAS is already reduced to account for the tailwind’s effect on stopping; by not adding the tailwind back to the groundspeed gate, the simplified threshold sits below the actual V1 energy state.
This provides an additional safety margin: the crew will reject at lower kinetic energy than V1 represents, consistent with the interim nature of the simplified method.
Table 3: Simplified k-factor selection for operational use.
The k-factors are derived analytically from the density ratio σ = (p/p₀)(T₀/T). For standard conditions (sea level to 8,000 ft, −25°C to +50°C, QNH 29.50–30.50 inHg), the density ratio spans approximately σ = 0.75–1.15, yielding 1/√σ in the range 0.93–1.15. The standard k = 0.9 therefore guarantees a gate at or below the exact GSV1 across this entire envelope—a worst-case bound, not an approximation.
The dense air category (k = 0.8) applies when temperature falls below −25°C or QNH exceeds 30.50 inHg, corresponding to σ ≈ 1.15–1.33 where 1/√σ drops below 0.92, making k = 0.9 insufficient.
At sea level with QNH 30.70 inHg and −50°C, σ reaches approximately 1.33—near-maximum density for extreme Arctic operations—and 1/√σ ≈ 0.87, confirming that k = 0.8 provides adequate margin even at this boundary. The conservatism penalty (exact GSV1 minus simplified GSV1) has been characterized across the operational envelope via the sensitivity analysis in Fig. 10, showing that the simplified method introduces 5–15 kt of unnecessary margin depending on conditions—a bounded, quantified cost that is eliminated when the exact method is adopted.
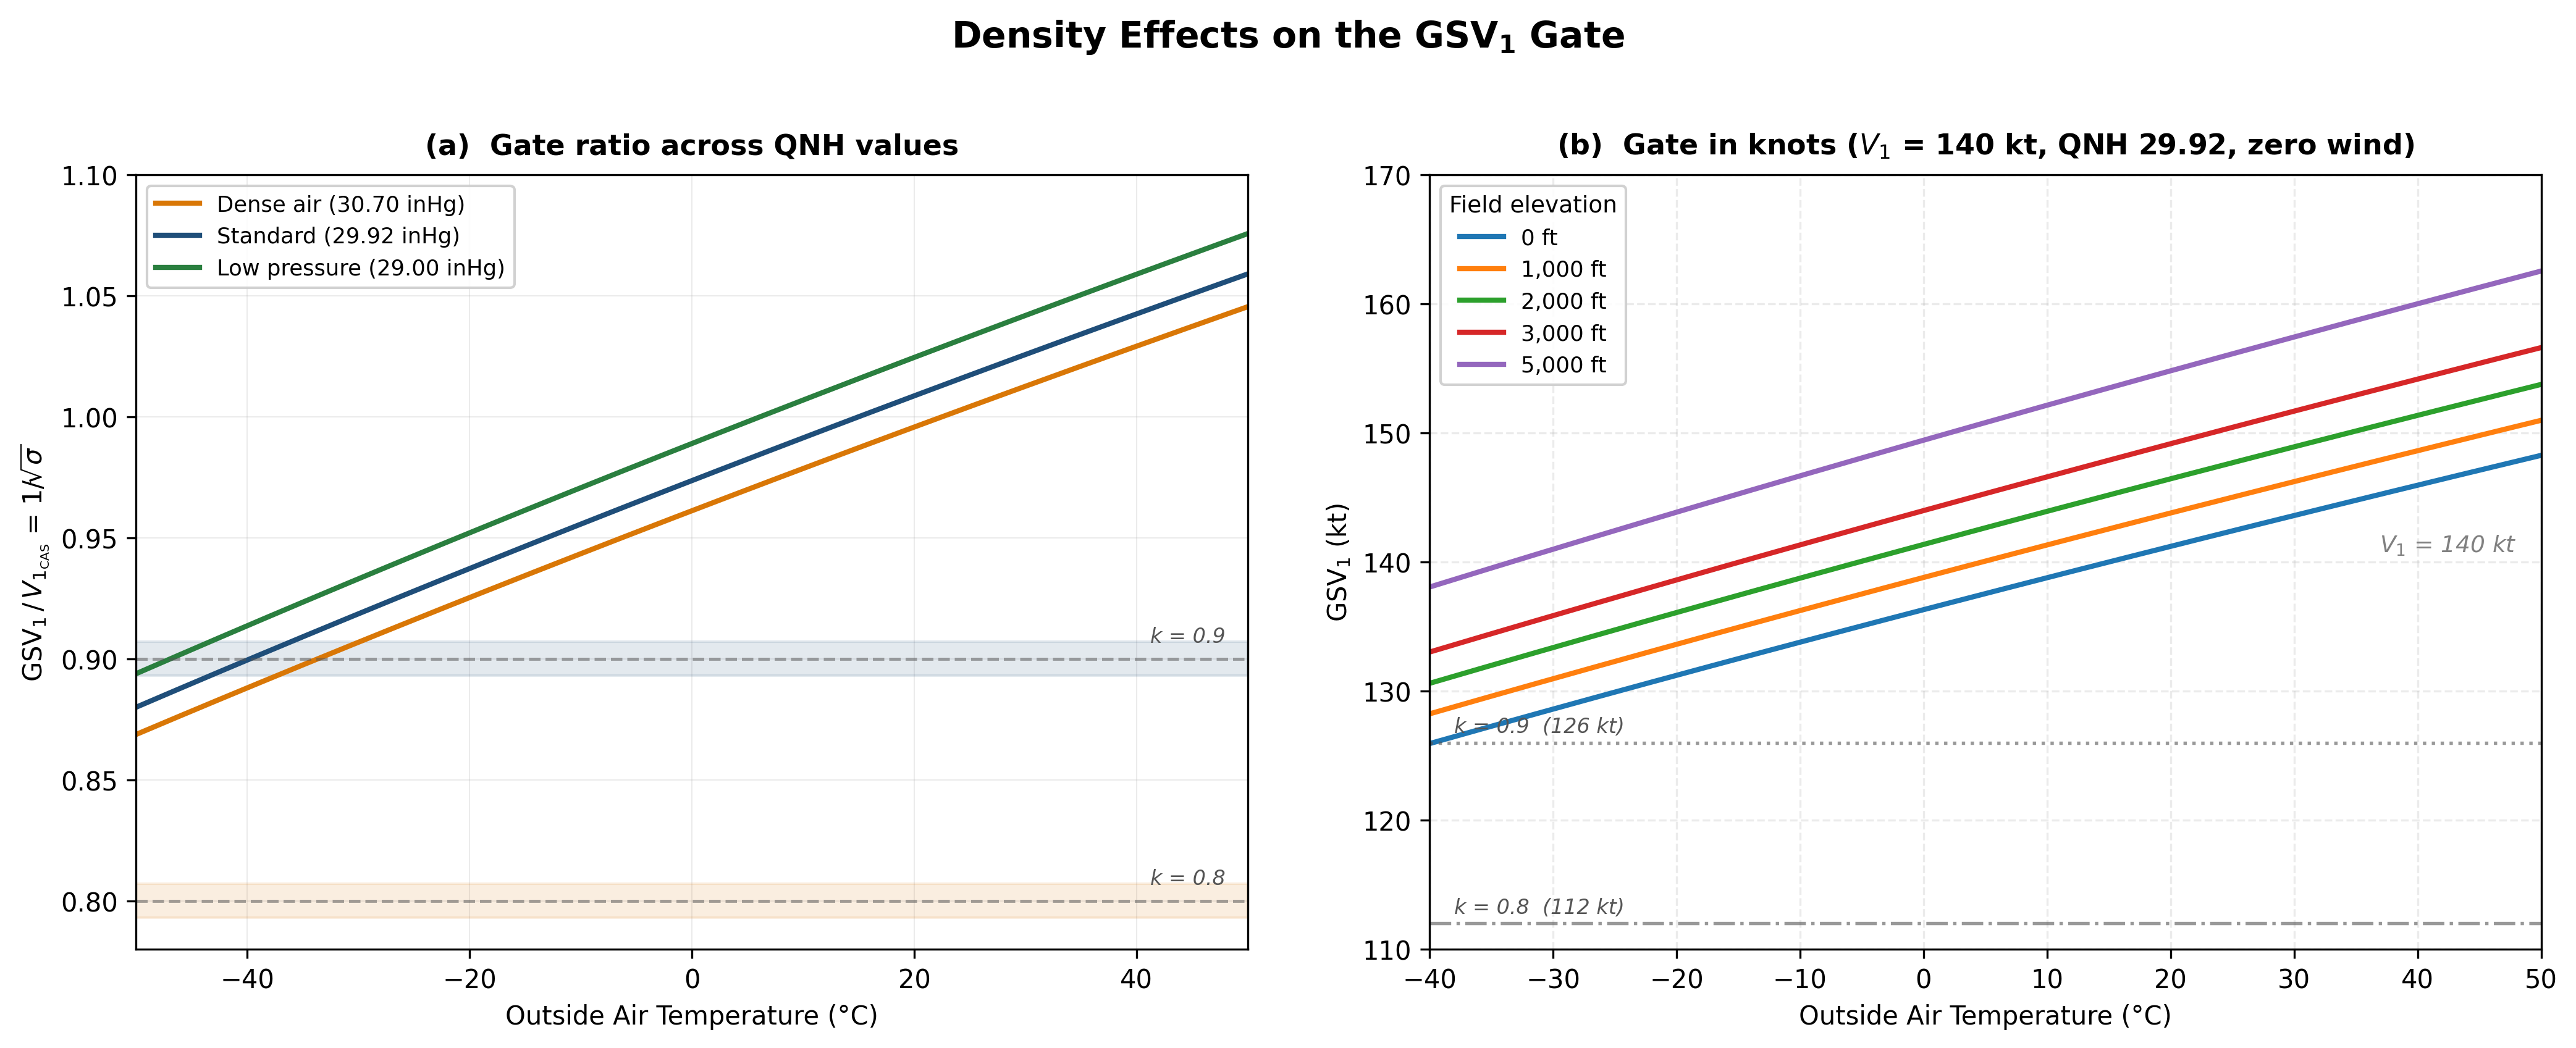 Click to enlarge
Figure 8. Density effects on the GSV1 gate. (a) Ratio GSV1/V1,CAS = 1/√σ as a function of outside air temperature for three QNH values, with dashed lines indicating the k = 0.9 and k = 0.8 simplified factors. Dense air (high QNH, cold temperature) reduces the ratio below unity; thin air raises it. (b) GSV1 in kt for V1,CAS = 140 kt across a range of temperatures and field elevations (QNH 29.92 inHg, zero wind). At standard sea-level conditions, GSV1 equals V1,CAS. Cold dense air reduces the gate (e.g., 129 kt at sea level and −30°C), while hot or high-elevation conditions raise it (e.g., 161 kt at 5,000 ft and 45°C). Dashed lines indicate the simplified k-factor gates for comparison.
4.3. Density effects and worked examples
Atmospheric density directly affects the IAS-to-TAS relationship, varying the GSV1 threshold by up to 10 kt across the operational envelope. At International Standard Atmosphere (ISA) sea-level conditions (σ = 1.0), GSV1 equals V1,CAS. Cold air increases density: at T = −20°C with standard pressure, σ ≈ 1.14, reducing the gate to 0.94 · V1,CAS — an 8 kt reduction for V1,CAS = 140.
Pressure effects alone are modest (1 kt at QNH = 30.50 inHg), but cold and high pressure compound: at T = −20 °C and QNH = 30.50 inHg, the gate drops to 0.93 · V1,CAS, a 10 kt (7.1%) reduction. A crew monitoring only IAS during stagnation could overestimate its energy margin by this amount.
The opposite occurs at elevated airports, where σ < 1 produces GSV1 > V1,CAS. This is not a worst-case concern: the higher gate correctly reflects extended stopping distances at altitude, and the certified V1 already accounts for thin-air deceleration. Figs. 8–10 characterize the full sensitivity landscape across temperature, pressure, and elevation.
The simplified k-factors are chosen to provide a uniformly conservative gate across the operational envelope without requiring operator-specific density calculations during high-workload flight operations. The standard factor k = 0.9 is appropriate for normal operations (typical ambient temperatures between −5°C and 25°C, QNH between 29.60 and 30.30 inHg), covering approximately 90% of commercial operations worldwide.
The dense-air factor k = 0.8 is applied only when either extreme condition is met: (1) temperature below −25°C, which occurs in high-latitude winter operations (Anchorage, Fairbanks, Montreal winter), or (2) QNH exceeding 30.50 inHg, which occurs in strong high-pressure systems (rare but extreme in continental Europe and Asia). These thresholds ensure that the k = 0.9 factor never provides insufficient conservatism while avoiding unnecessary over-conservatism for typical operations.
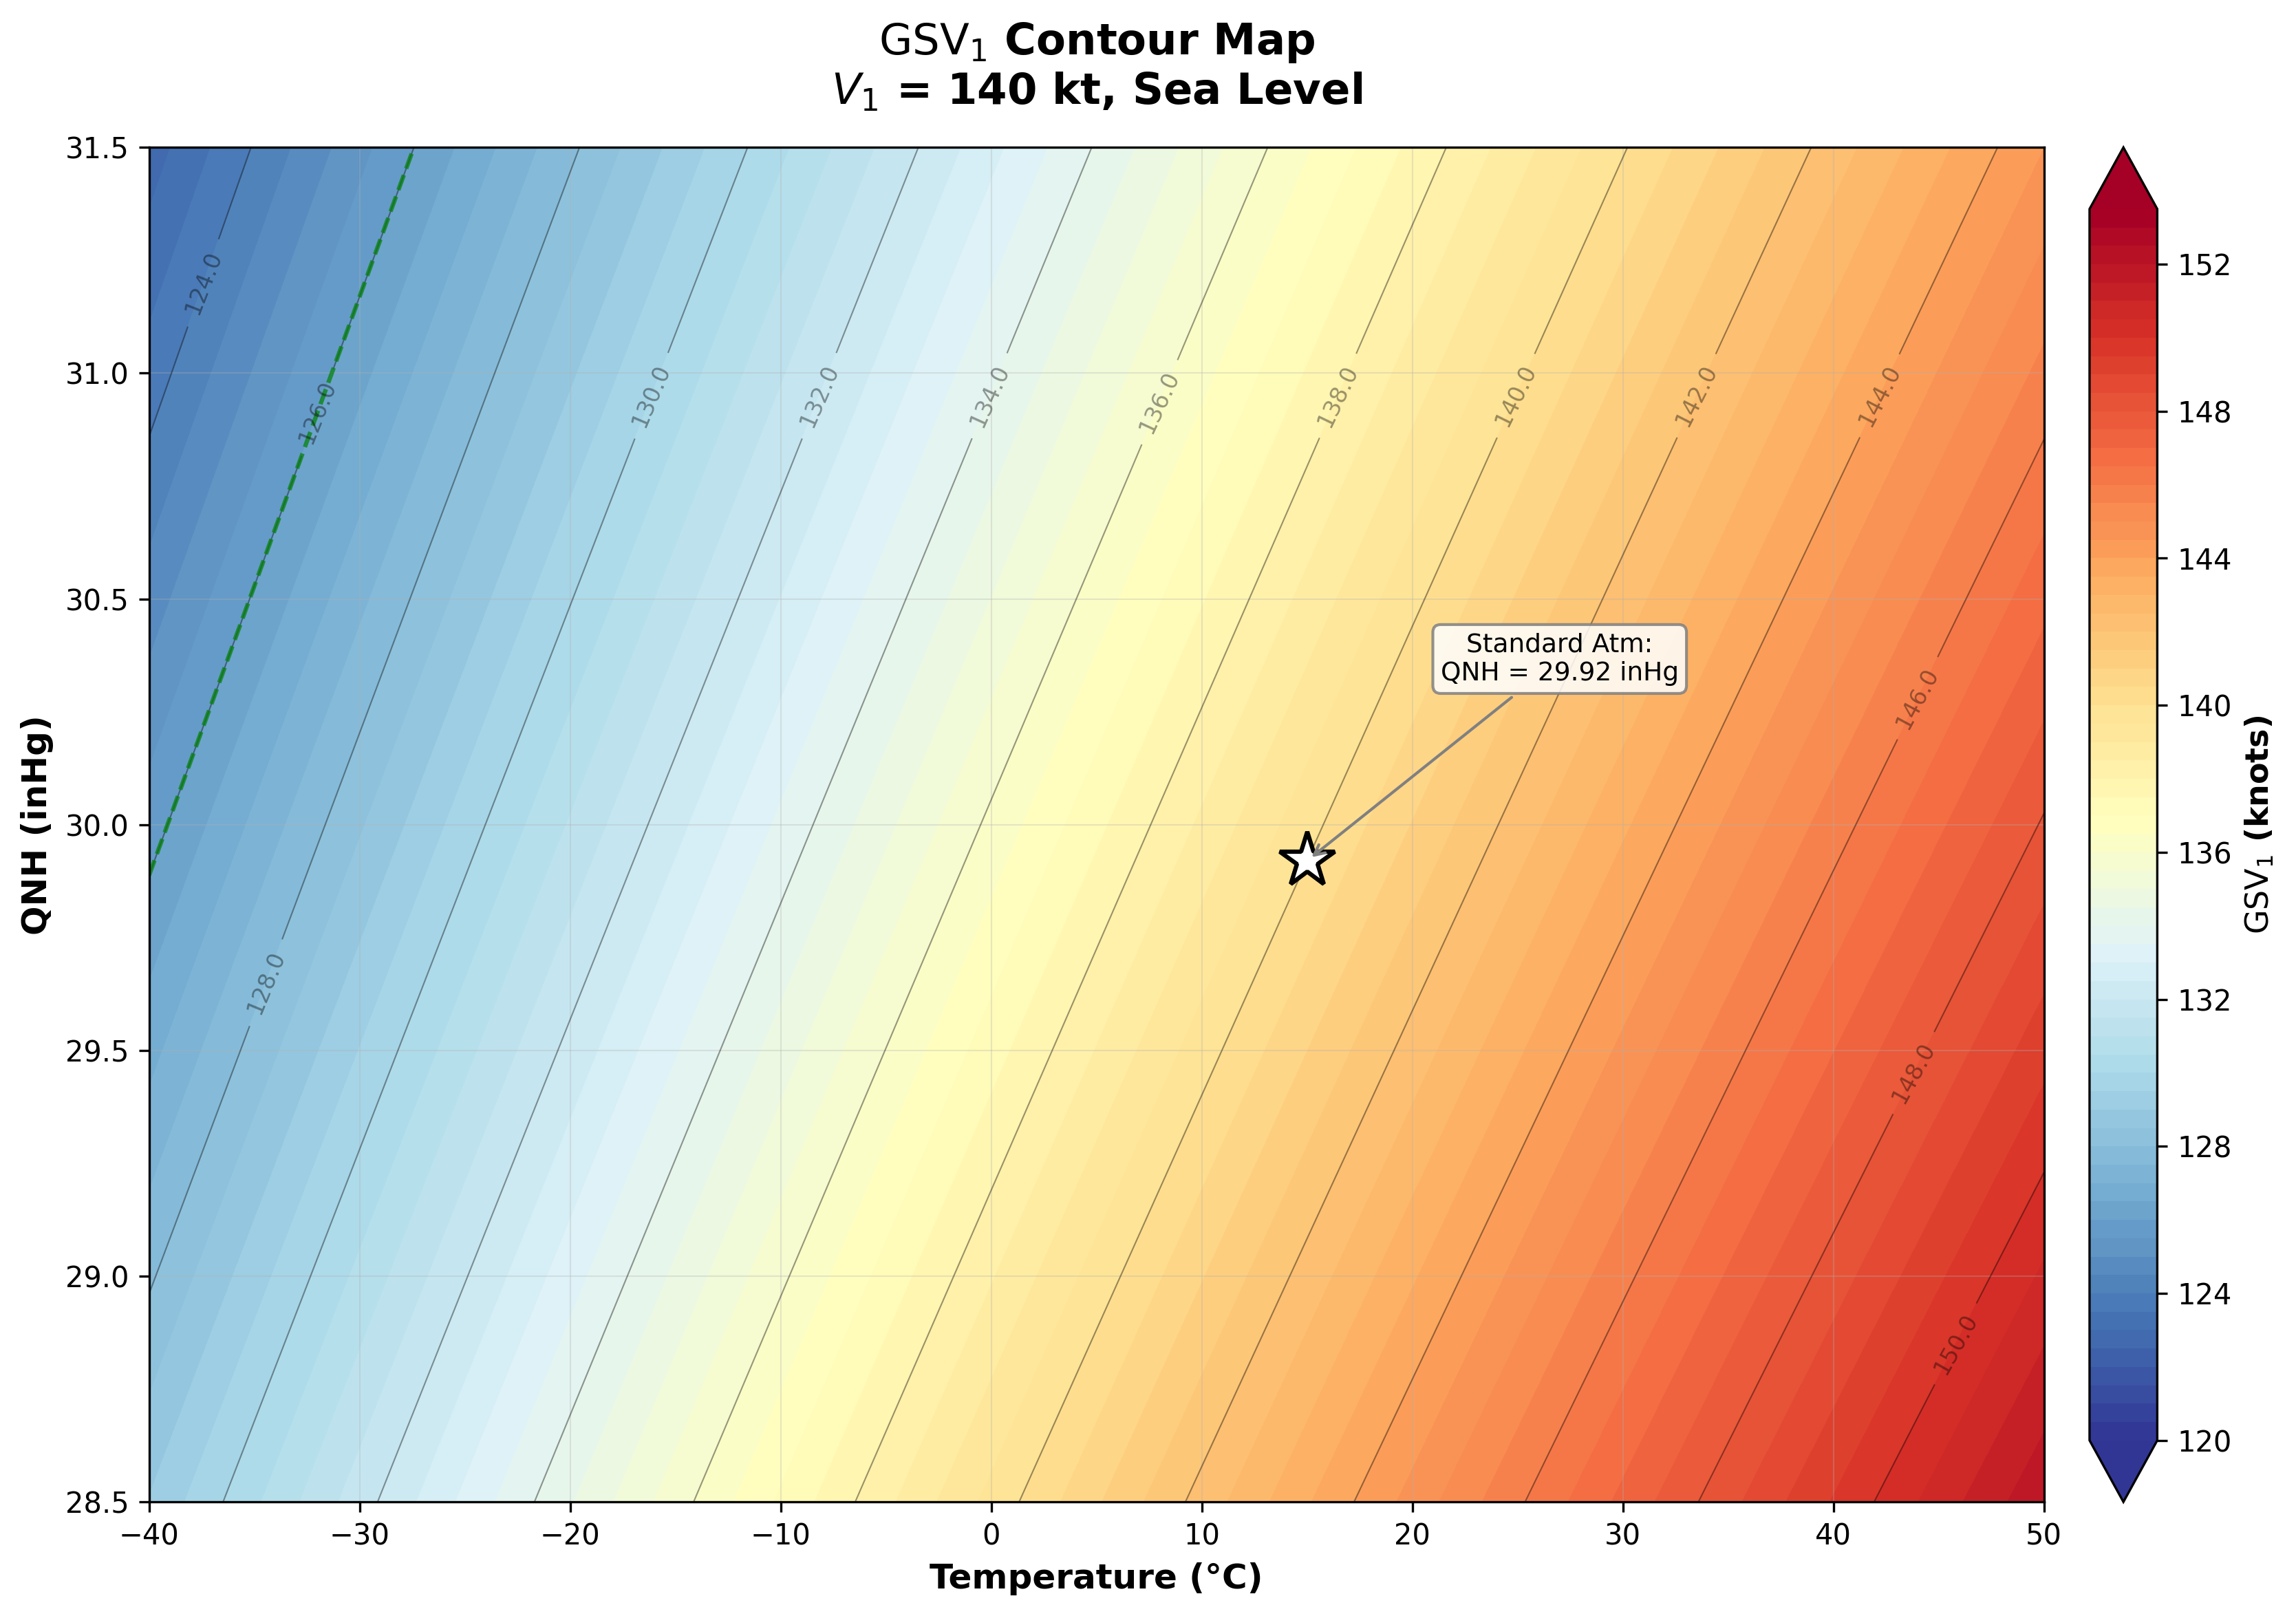 Click to enlarge
Figure 9. GSV1 contour map at sea level showing the combined effect of outside air temperature and altimeter setting (QNH) on the groundspeed gate. Warmer temperatures and lower QNH (thin air) increase GSV1 above V1,CAS, while cold temperatures and high QNH (dense air) decrease it. The white star marks standard-atmosphere conditions (15°C, 29.92 inHg). Green dashed contours correspond to the density ratios at which the k = 0.9 and k = 0.8 simplified factors apply.
 Click to enlarge
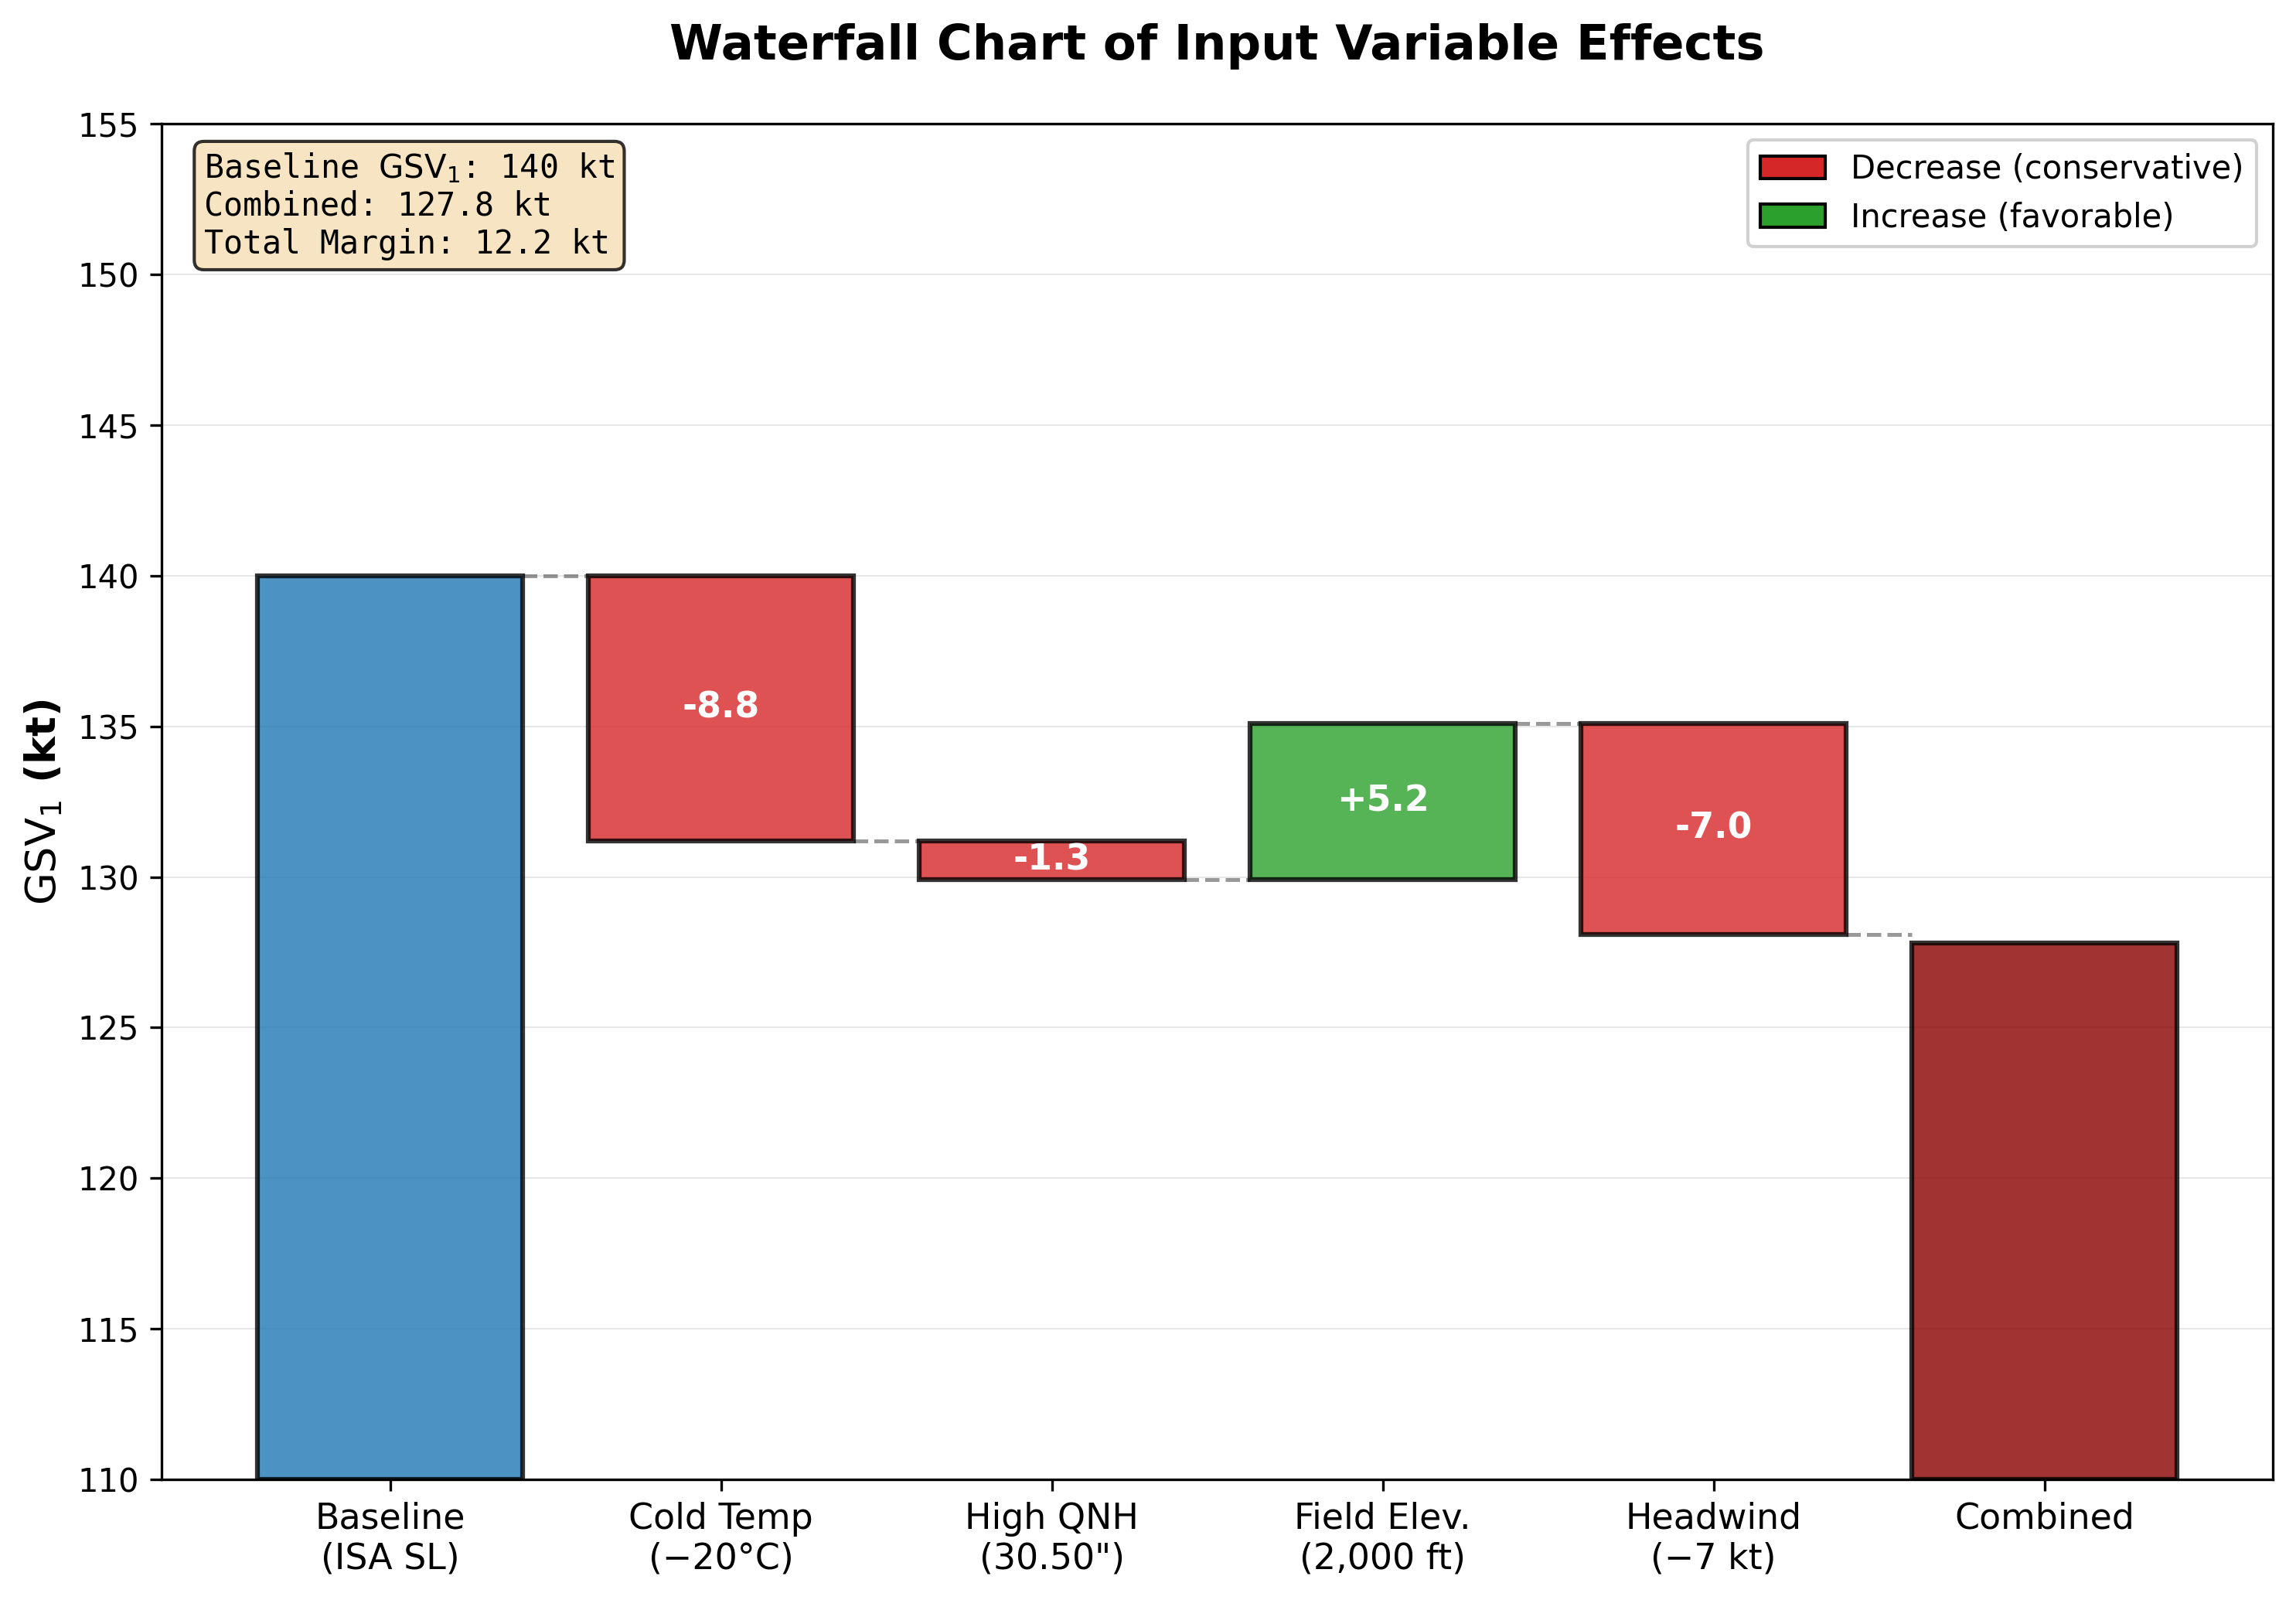
Figure 10. Sensitivity waterfall showing the independent and combined effect of each input variable on the GSV1 gate, starting from a baseline of 140 kt (ISA sea level, QNH 29.92 inHg, zero wind). Cold temperature (−20°C) produces the largest single reduction (−9 kt), followed by a required headwind credit (−7 kt) and high pressure (QNH 30.50 inHg, −1 kt). Field elevation (2,000 ft) raises the gate (+5 kt) because thinner air increases the TAS/CAS ratio. Under the combined scenario, the gate falls to approximately 128 kt—a 12-kt margin that the simplified k-factor method captures conservatively.
4.4. Altitude effects
At sea-level airports, the baseline case (h = 0, ISA, QNH 29.92 inHg) yields σ = 1.0 and GSV1 = V1,CAS. Cold or high-pressure conditions increase σ above unity, reducing the gate; warm or low-pressure conditions decrease σ, raising it. The k = 0.9 factor covers the range of typical sea-level operations (Miami summer through New York winter); k = 0.8 covers the extreme cold and high-pressure conditions detailed in Figs. 8–10.
At elevated airports, reduced atmospheric pressure dominates. Denver (5,280 ft, ISA) yields σ ≈ 0.86 and GSV1 ≈ 1.08 · V1,CAS — an 11-knot increase for V1,CAS = 140. At La Paz (13,615 ft), σ ≈ 0.66 pushes GSV1 to roughly 1.23 · V1,CAS. These higher gates correctly reflect extended stopping distances at altitude; the certified V1 already accounts for thin-air deceleration, and GSV1 expresses the same energy state in ground-referenced terms.
4.5. Proposed SOP integration
 Click to enlarge
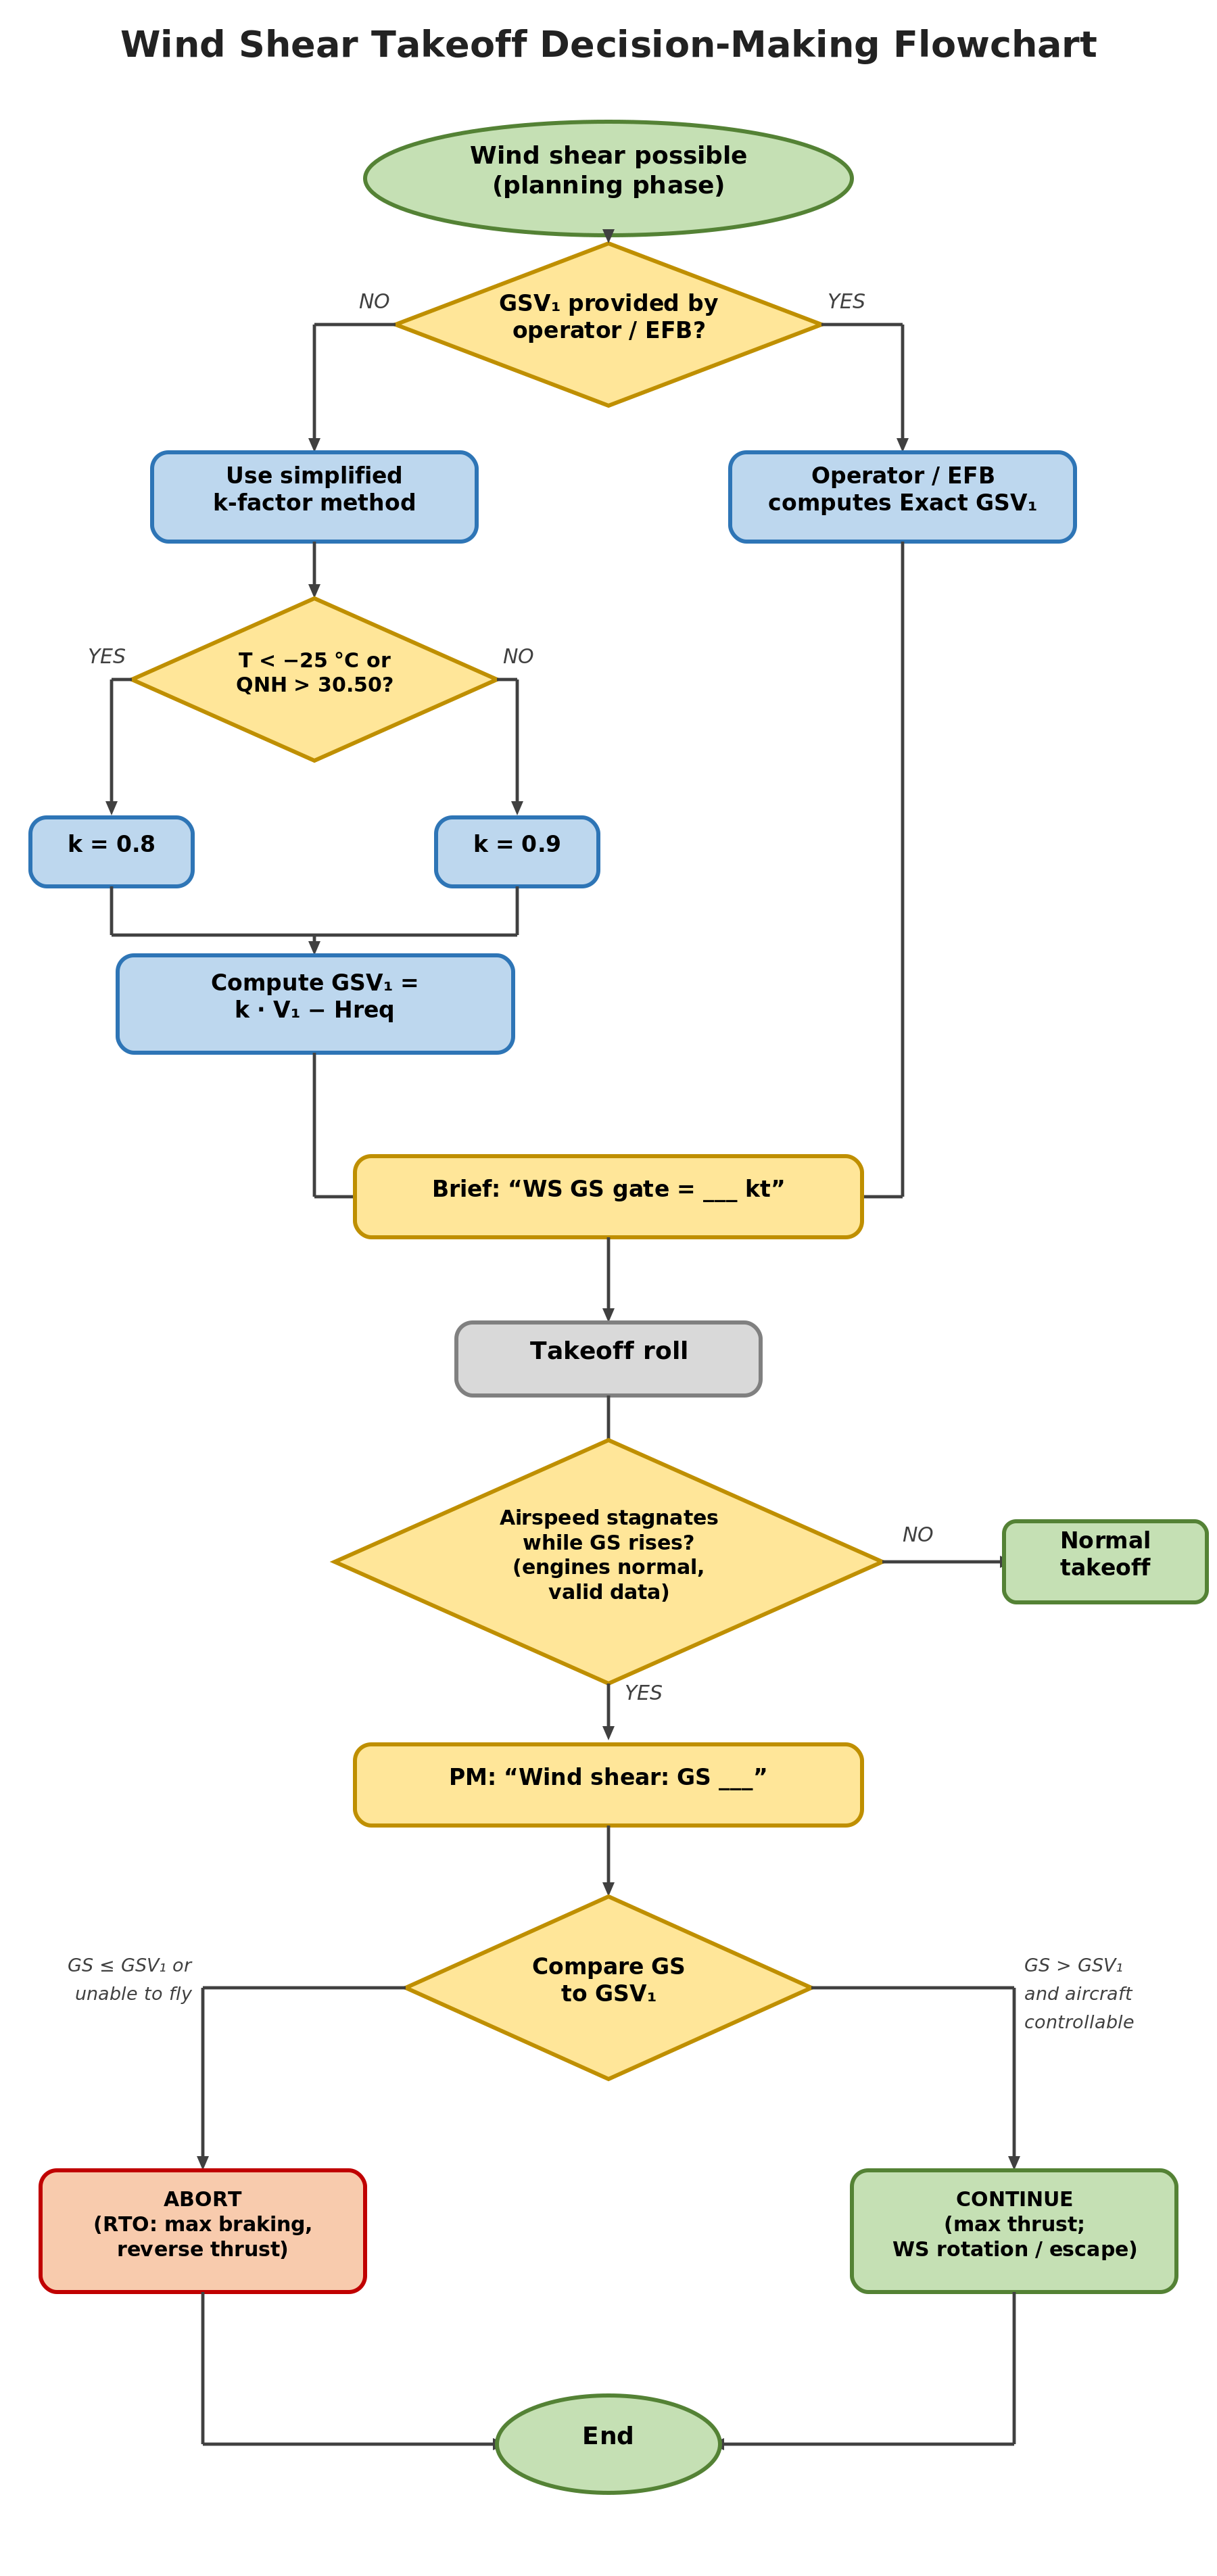
Figure 11. Decision flowchart for wind shear takeoff decision-making. Wind shear detection (IAS stagnation with normal engine parameters and valid groundspeed) triggers method selection: exact GSV1 (if operator-provided or EFB available) or simplified heuristic (k-factor mental arithmetic). The crew compares current groundspeed against the GSV1 threshold: if VGS ≤ GSV1 or aircraft unable to fly, abort with maximum braking and reverse thrust; if VGS > GSV1 and aircraft able to fly, continue with maximum thrust and wind shear escape maneuver.
To embed this method operationally, the following standardized procedures are proposed to integrate into crew training, flight crew operating manuals, and standard operating procedures:
Takeoff briefing (when applicable): “Wind Shear Groundspeed Gate = ___ kt.”
During takeoff roll (when airspeed stagnation is recognized and after verifying engine parameters are normal):
PM: “Wind shear. IAS stagnated. Groundspeed ___ [current reading].”
CA decision: If VGS ≤ gate or aircraft unable to fly: “Abort”
Execution (after “Abort” call): PF rejects using maximum braking and reverse thrust per SOP; PM monitors deceleration, brake temperature, and remaining runway; both pilots prepare for runway overrun contingencies if deceleration is insufficient.
CA decision: If VGS > gate and aircraft able to fly: “Continue”
Execution (after “Continue” call): PF continues with maximum thrust; both pilots follow fleet wind shear rotation and escape procedures; PM monitors airspeed trend, altitude gain, and performance margins.
The standardized callouts are designed to mitigate plan-continuation bias (Orasanu and Davison, 2001) by maintaining shared situation awareness (Endsley, 1995) through a structured PF/PM format. The PM provides the groundspeed reading; the PF makes the abort-or-continue decision, remaining focused on aircraft control rather than instrument scanning or mental calculations.
5. Case application: winter departure scenario
A winter departure scenario illustrates both methods under challenging conditions—cold temperature, high pressure, and a required headwind on a performance-limited runway. The scenario is a constructed example using representative parameters; it is not derived from flight data recorder data or tied to a specific event. Published investigation reports, including the AAIB East Midlands case (AAIB, 2020) and the ATSB Perth event (ATSB, 2013), informed the choice of conditions, but all numerical values are illustrative.
Table 4: Scenario departure conditions.
5.1. Exact calculation
First, compute static pressure at the 2,000-ft field elevation. With QNH = 1032 hPa:
With QNH = 30.47 inHg, the conversion yields 30.47 × 33.8639 = 1032 hPa at sea level, and p(2,000) = 1032 × 0.930 = 959.8 hPa. The density ratio σ combines pressure and temperature effects:
σ = 0.947 × 1.079 = 1.022, indicating air 2.2% denser than standard due to high pressure partially offset by moderate cold (−6°C). The speed-scaling factor is 1/√σ = 1/√1.022 ≈ 0.989. Applying the 7-kt required headwind:
The exact GSV1 gate is 140 kt—the groundspeed at which the aircraft has the same kinetic-energy state originally certified for V1 = 149 KIAS under the actual density and wind conditions of this departure.
5.2. Simplified method
The simplified method uses pre-computed k-factors. Current conditions (T = −6°C, QNH = 30.47 inHg) do not exceed the extreme-density thresholds (T < −25°C or QNH > 30.50 inHg), so k = 0.90 applies:
The simplified gate of 127 kt is 13 kt below the exact value (140 kt), representing intentional conservatism. In energy terms, (140/127)² ≈ 1.215, meaning the simplified method requires the aircraft to be 21.5% below its actual V1 energy state before directing a rejection. This margin constitutes the Risk of Design-induced Missed Abort (RDMA), accepted as an interim measure until operators integrate exact GSV1 computation into EFB tools.
5.3. Resolution
Table 5: Scenario results comparison.
At the critical event point, a headwind collapse from the briefed 7 kt to an effective tailwind of approximately 17 kt—a 24-kt wind shift exceeding the FAA severe-shear threshold—has produced IAS = 104 kt while VGS = 120 kt. Both methods confirm the aircraft had not yet achieved the ground-referenced energy corresponding to V1. The IAS-to-groundspeed divergence of 16 kt illustrates the severity of the wind shear encounter: groundspeed was 15% above indicated airspeed due to wind shear effects.
Had the crew been equipped with a pre-briefed groundspeed gate, they would have had an objective, quantitative reference precisely when wind shear compromised the IAS-based V1 framework.
The 13-kt difference between exact and simplified gates (18% kinetic-energy margin) illustrates why the exact method should be the target for permanent operational adoption, with the simplified method providing interim utility.
6. Implementation and constraints
6.1. Mandatory prerequisites
The groundspeed-based decision criterion is applicable only when three preconditions are satisfied. First, groundspeed indication must be valid: IRS or GNSS groundspeed must be available, reliable, and current, with no flags or warnings indicating sensor failure or quality degradation. Second, the crew must have confirmed a wind shear condition, distinguishing airspeed stagnation from instrument malfunction, systems failure, or engine problems through cross-check with engine parameters—fan speed (N1), fuel flow, and exhaust gas temperature (EGT) all normal—autopilot response, and secondary airspeed sources if available.
Third, adequate directional control must be maintained and the aircraft must remain within the normal control envelope.
Operationally, crews should identify airspeed stagnation as a sustained condition (not transient fluctuation) lasting more than 3 seconds while groundspeed continues to increase normally. If any prerequisite is not met, crews shall revert immediately to existing manufacturer wind shear guidance. The intent is to make the GSV1 method an enhancement, not a replacement, for existing procedures when all supporting information is available.
Regulatory and certification context: V1 is determined by accelerate-stop distance calculations under 14 CFR Part 25.107-109. The GSV1 method does not modify V1 itself or bypass any Part 25 requirement; it simply provides a ground-referenced interpretation of the same energy state when IAS alone ceases to reflect stopping-distance margin during wind shear.
6.2. Contaminated runways and braking considerations
On contaminated runways (wet, slippery, or snow-covered), groundspeed remains the correct reference for kinetic energy governing stopping distance, though stopping-distance margins are narrower and accelerate-stop performance must be recalculated using contaminated runway friction coefficients. When operating near the groundspeed gate under such conditions with normal acceleration and adequate controllability, crews will likely favor a “continue” bias.
When using the exact method, the gate includes the full wind component W∥ (Section 4.1), replicating the V1 energy state regardless of wind direction. When using the simplified method, only performance-required headwind is subtracted and tailwind is omitted, providing additional conservatism (Section 4.2). In either case, manufacturers’ performance data already account for runway surface conditions when computing V1; the GSV1 method simply expresses that energy state in ground-referenced terms without altering the underlying performance calculations.
6.3. Risk of Design-induced Missed Abort (RDMA)
The simplified method, due to its intentionally conservative k-factor derivation, introduces a Risk of Design-induced Missed Abort (RDMA). For groundspeeds between the simplified GSV1 (e.g., 127 kt) and the exact GSV1 (e.g., 140 kt), the simplified rule directs “continue” even though the aircraft possesses the physical energy margin for a safe abort. This risk is explicitly accepted as an interim measure to mitigate the greater and less-bounded Status-Quo Risk (RSQ) associated with ambiguous high-energy continuation decisions during IAS stagnation.
Because the RDMA is bounded and explicitly quantified — and eliminated entirely when the exact method is used — it represents a more predictable risk profile than the status quo, in which crews have no quantitative reference at all. The simplified method should therefore be treated as an interim SOP, with the EFB-integrated exact method as the preferred target for permanent implementation.
Operators should track the frequency with which departures fall into the RDMA window (GSV1(simplified) < VGS < GSV1(exact)) as a key performance indicator for migration to the exact method.
6.4. Regulatory and approval framework
Because the method uses only existing certificated data sources (GNSS, IRS, air data) and introduces no hardware or software modifications to type-design systems, the authors contend it constitutes an operational enhancement rather than a type-design change, and that compliance findings to 14 CFR §25.1309 (FAA, 2025b) or EASA CS-25.1309 would not be required. The pitot-static, inertial, and GNSS systems operate entirely within their certificated envelopes; only the operational interpretation of their outputs is reinterpreted.
This classification would need to be confirmed through formal consultation with the relevant certification authority, as the boundary between operational procedures and type-design changes can be subject to regulatory interpretation.
The authors propose that deployment could proceed through three established regulatory channels that have precedent for similar operational enhancements. The feasibility of each pathway would need to be confirmed through consultation with relevant authorities:
(1) SOP revision: Operators incorporate the method into SOPs and Flight Crew Operations Manual (FCOM) through existing principal operations inspector (POI; FAA) or competent-authority (EASA) approval processes. Similar SOP enhancements are approved through these channels annually without triggering certification activity.
(2) EFB integration: The GSV1 calculation fits naturally into Type A or B EFB performance applications under FAA AC 120-76E (FAA, 2024a), EASA SPA.EFB.100 (EASA, 2025a), and ICAO Doc 10020 (ICAO, 2018). EFB integration requires vendor approval and validation of the calculation logic but does not require aircraft type certification. The simplified method serves as backup when the EFB is inoperative.
(3) Training integration: Scenario-based simulator events under 14 CFR §121.415/419 (FAA) or ORO.FC.120/230 (EASA) would cover wind shear recognition, gate briefing, and decision execution. Many operators already include wind-shear simulator events; integrating the GSV1 gate requires only SOP and briefing-card updates.
The method is consistent with the crew-interface principles in §25.1302 (FAA, 2013): the pre-briefed gate provides an unambiguous cue, the standardized callouts reduce miscommunication risk, and the engine-parameter prerequisite prevents misapplication to engine-failure scenarios.
6.5. SOP integration examples
During the pre-flight briefing, PF and PM confirm the gate value, the k-factor applied (0.9 or 0.8), and the execution rule: reject if GS ≤ gate or if the aircraft is unable to fly. During the takeoff roll, if the PM observes sustained IAS stagnation (>3 seconds with normal groundspeed increase), the PM calls “Wind shear. Groundspeed ___” and provides updated readings every 2 seconds. The PF decides: abort (if VGS ≤ gate or control is degraded) or continue (if VGS > gate and handling is normal). The expected timeline from detection to decision is 5–10 seconds.
If any prerequisite fails—engine-parameter anomaly, groundspeed display degradation, or unconfirmed shear—the method is abandoned and existing manufacturer guidance takes precedence.
6.6. Implementation roadmap
Table 6: Implementation roadmap: phased deployment of the GSV1 framework.
A working open-source interactive calculator implementing both methods with live weather integration is freely available and can serve as a reference implementation for EFB development and crew training.
7. Validation pathway
The theoretical framework presented requires systematic empirical validation before operational adoption. Three phases are proposed, with strategic overlap reducing total timeline to 24–30 months. This section outlines the specific data collection, analysis, and human-factors validation needed to establish the safety case and crew performance characteristics.
The validation pathway addresses three questions: (1) How often does airspeed stagnation actually occur in commercial operations? (2) Can crews execute the GSV1-based decision procedure reliably under operational stress? (3) Does the method provide quantifiable safety benefit?
7.1. Phase 1: flight-data analysis
FOQA or quick-access recorder (QAR) datasets across 100,000+ takeoffs from multiple operators would quantify the industry-wide event rate for IAS stagnation in the high-energy regime (80–100 kt to V1). Event detection algorithms would identify sequences where IAS rate-of-change falls below 0.5 kt/s for more than 3 seconds while engine thrust (N1 stable within ±2%) and control inputs remain normal—distinguishing true wind shear from sensor degradation or engine problems.
Events would be segmented by aircraft type, geographic region, season, and atmospheric conditions to determine whether IAS stagnation is a universal phenomenon or concentrated in specific environments.
Model validation would compare actual groundspeed at detected IAS-stagnation points with predicted GSV1 across at least 1,000 independently-selected events, spanning density ratios σ = 0.7–1.2, wind conditions ±15 kt, and field elevations from sea level to 8,000 ft. The dataset should include narrow-body, wide-body, and regional-jet families. Regional jets are of particular interest because PWS inhibition (at 80–100 kt) may prevent automated shear detection early in the takeoff roll.
The target is root-mean-square (RMS) prediction error < 2 kt and correlation coefficient > 0.99 across the operational envelope. A secondary goal is quantifying the business case: event frequency data inform implementation priorities and cost-benefit calculations.
7.2. Phase 2: simulator studies
A minimum of 50 crew pairs, representing a cross-section of seniority, airline size, and aircraft type, would execute realistic wind shear scenarios in full-flight simulators. Scenarios would include headwind collapse, microburst encounters, terrain-induced shear, and frontal passages, with shear onset at early (50 kt), mid-roll (80 kt), and late (100–120 kt) stages. Comparative trials would contrast GSV1-equipped crews against baseline crews following existing manufacturer guidance.
Recorded measures include recognition time (target < 5 s), decision latency (target < 10 s), stopping-distance margins (target > 15% ASDA), NASA Task Load Index (TLX) workload ratings, and Situation Awareness Rating Technique (SART) scores. Two boundary-case scenarios are essential: (1) engine failure immediately following IAS stagnation, testing whether crews correctly revert to engine-failure procedures, and (2) a controllability-limit scenario where GS exceeds GSV1 but IAS remains at or below minimum control speed, testing whether crews correctly override the “continue” indication.
Success criteria include 95%+ correct decision rate, mean decision latency < 10 s, 100% correct response in boundary cases, and crew satisfaction > 3.5/5.
7.3. Phase 3: operational validation
Limited trials with designated line-evaluation crews would involve briefing GSV1 gates on 50–100 takeoffs in wind-shear-prone environments (tropical thunderstorm regions, complex terrain, high-altitude airports). Documentation would capture ease of SOP integration, crew decision confidence (via post-flight Likert-scale surveys), brake temperatures and stopping margins, and operational anomalies. Success criteria include 90%+ crew satisfaction, no adverse safety events, and clean SOP integration.
Table 7: Validation timeline with strategic phase overlap.
Results from all three phases would be compiled into a formal safety case for FAA/EASA operator approval. FOQA analysis must be substantially complete before Phase 3, since regulatory justification requires event-frequency data. Conservative planning should budget 30–36 months to accommodate data collection delays and regulatory review cycles.
8. Discussion
This paper addresses a recognized gap in takeoff wind shear guidance: the absence of a quantitative, ground-referenced decision threshold when indicated airspeed stagnates during the high-energy takeoff regime. The relationship between groundspeed and stopping energy is well established in aeronautical engineering, but translating it into a cockpit-usable abort criterion—without recomputing the manufacturer’s certified stopping performance—had not been attempted.
Why this gap persisted for roughly four decades after the JAWS-era wind shear research is worth considering. Three factors likely contributed. First, the success of ground-based detection—Terminal Doppler Weather Radar (TDWR) and LLWAS—and onboard reactive/predictive systems in reducing approach-phase accidents shifted research attention away from the takeoff roll, where encounters are rarer and less well documented.
Second, the certification framework anchors V1 to indicated airspeed; translating it to groundspeed requires density-ratio arithmetic that, before EFB integration became routine, was impractical for line crews. Third, the rarity of documented takeoff-roll wind shear events meant the problem attracted less institutional urgency than higher-frequency hazards.
The two-tier approach balances precision against immediate usability. The exact method, suitable for EFB integration, provides the correct energy-equivalent threshold with no conservatism penalty. The simplified method trades precision for deployability, introducing a deliberately bounded Risk of Design-induced Missed Abort (RDMA) that we accept as an interim measure.
The RDMA does introduce a narrow risk of missed abort opportunities—for example, groundspeeds between 127 kt and 140 kt in the worked scenario—but it is bounded and predictable. The corresponding risk under current practice, where crews have no quantitative reference during IAS stagnation, is neither bounded nor quantified.
The framework’s reliance on existing groundspeed displays and certificated data is both its primary strength and a recognized limitation. It can be deployed through routine SOP revision and EFB authorization without aircraft modification. However, aircraft equipped with AHRS rather than full IRS may have degraded groundspeed quality; operators with mixed avionics architectures will need to address this on a fleet-by-fleet basis (Section 3.2).
The SOP integration—PF/PM callouts with a pre-briefed gate—is intended to counter the plan-continuation bias identified by Orasanu and Davison (2001) and the interpretive variability documented by Fischer et al. (2008). By converting a subjective runway-remaining assessment into a binary comparison (current groundspeed versus pre-briefed gate), the procedure aims to reduce cognitive load at the decision point, consistent with crew resource management (CRM) principles and the error-reduction objectives of 14 Code of Federal Regulations (CFR) §25.1302 (FAA, 2013).
Whether this translates into measurable workload reduction and better decisions is an empirical question—one the simulator studies in Section 7.2 are designed to answer.
When the crew elects to continue (GS > GSV1), the takeoff transitions into the manufacturer’s published wind shear escape maneuver. The GSV1 framework addresses only the abort-or-continue decision; operators should ensure their SOP explicitly sequences the GSV1 decision before the escape procedure.
Several limitations bear emphasis. The framework is a conceptual and operational proposal that has not yet been validated empirically. It applies only to confirmed wind shear conditions with valid groundspeed indications; it does not cover simultaneous system failures, engine failure, crew incapacitation, or loss of groundspeed data. We have not subjected the derivation to large-scale flight data analysis or to human-factors simulator validation. Procedures that appear sound on paper may fail in practice—crew adoption, training effectiveness, and real-world decision timing cannot be assumed.
The validation pathway outlined in Section 7 is therefore not optional. Operational adoption without empirical evidence of crew performance under realistic conditions would be premature.
Because the V1 already embodies all certificated performance margins, including those for accelerate-stop distance, minimum control speed, brake energy, and tire speed limits, the GSV1 transformation introduces no new performance margins and bypasses no certified limit. The aircraft's ability to stop is unchanged; only the reference frame for the decision cue is shifted from air-relative (IAS) to ground-relative (GS) when wind shear has decoupled IAS from the aircraft's ground-referenced energy state.
Future work falls into three areas: FOQA-based frequency analysis to establish operational relevance, simulator studies to provide quantitative safety-benefit evidence, and longer-term integration with next-generation flight management system (FMS) and synthetic vision displays. Because the derivation rests on the ICAO Standard Atmosphere and certification principles common to 14 CFR Part 25 and EASA CS-25, the method is applicable to any operator whose aircraft is certificated under either framework.
Finally, the F-factor hazard index already certified on transport aircraft under FAA Technical Standard Order (TSO)-C117b (FAA, 2018) provides a natural complement to the GSV1 framework. Existing onboard reactive wind shear systems detect the presence and severity of shear through the F-factor; GSV1 supplies the missing decision layer—the quantitative abort/continue threshold—that detection alone cannot provide. As Fig. 5 illustrates, the F-factor confirms the energy loss rate during the encounter, while the GSV1 gate provides the crew with a pre-briefed groundspeed reference for acting on that information.
9. Conclusions
Airspeed governs whether the aircraft can fly; groundspeed governs whether it can stop. During wind shear on the takeoff roll, it is the ground-referenced kinetic energy—not the indicated airspeed—that determines stopping distance. We have derived a physics-based framework for expressing the certificated V1 decision speed in ground-referenced terms, giving flight crews a briefable, objective threshold that preserves Part 25 certification intent without requiring hardware modification, new certification activity, or regulatory amendment.
The framework provides two complementary tools: an exact GSV1 calculation suitable for EFB integration, and a conservative simplified heuristic for interim use through mental arithmetic. Both complement—rather than replace—manufacturer wind shear guidance and existing rejected-takeoff doctrine.
This paper completes the theoretical foundation. Operational adoption requires the validation work described in Section 7: FOQA analysis to quantify IAS stagnation frequency, simulator studies to verify crew performance under stress, and operational trials to confirm SOP integration. Whether the theoretical case translates into measurably safer operations depends on that work.
No datasets were generated or analyzed during the current study. The framework is derived from publicly available atmospheric models and published certification standards.
During the preparation of this work, the author used Claude (Anthropic) to assist with manuscript formatting and editorial review. After using this tool, the author reviewed and edited the content as needed and takes full responsibility for the content of the publication.
References
AAIB, 2020. Boeing 737-86N, G-DRTN, East Midlands Airport, 9 February 2020. Air Accidents Investigation Branch, Farnborough, UK. Available at: https://www.gov.uk/aaib-reports/aaib-investigation-to-boeing-737-86n-g-drtn (accessed 5 March 2026). PDF↩ #34#81#83#85#90
Airbus, 2015. Wind shear: An invisible enemy to pilots? Safety First Magazine, Issue 19. Available at: https://skybrary.aero/sites/default/files/bookshelf/3833.pdf (accessed 5 March 2026). PDF↩ #10#19#33
Airbus, 2019. A318/A319/A320/A321 Flight Crew Operating Manual, Chapter 22 (Auto Flight), DSC-22_40-40: Windshear Detection Function; Chapter 34 (Surveillance), DSC-34-SURV-30-20: Predictive Windshear System. Airbus S.A.S., Blagnac. [Restricted distribution]. PDF↩ #11
Anderson, J.D., 2016. Fundamentals of Aerodynamics, 6th ed. McGraw-Hill Education, New York. ISBN 978-1-259-12991-9. PDF↩ #45#58
ATSB, 2013. Significant wind change during take-off involving Boeing 737, VH-VZL, Perth Airport, Western Australia, 4 December 2012. Australian Transport Safety Bureau, Canberra. Available at: https://www.atsb.gov.au/publications/investigation_reports/2012/aair/ao-2012-168 (accessed 5 March 2026). PDF↩ #86#87#91
Boeing, 1992. Takeoff Safety Training Aid. Developed by an industry taskforce led by Boeing Commercial Airplane Group for the Federal Aviation Administration, Washington, DC. Available at: https://www.cast-safety.org/pdf/takeoff_safety.pdf (accessed 5 March 2026). PDF↩ #52#53#57
Boeing, 2018. 737-700/800 Flight Crew Operations Manual, Rev. 30, Chapter 15: Warning Systems. The Boeing Company, Seattle. [Restricted distribution]. PDF↩ #12
Chan, P.W., 2012. A significant wind shear event leading to runway change at the Hong Kong International Airport. Meteorological Applications 19(1), 10–16 https://doi.org/10.1002/met.242. PDF↩ #36#77
Daidzic, N.E., 2016. Unbalanced field takeoffs. International Journal of Aviation, Aeronautics, and Aerospace 3(3), Article 3 https://doi.org/10.15394/ijaaa.2016.1129. PDF↩ #41#46#54#73#84
EASA, 2023a. Certification Specifications and Acceptable Means of Compliance for Large Aeroplanes CS-25, Amendment 28. European Union Aviation Safety Agency, Cologne. Available at: https://www.easa.europa.eu/en/document-library/certification-specifications/cs-25-amendment-28 (accessed 5 March 2026). PDF↩ #16
EASA, 2025a. Air Operations Regulation (EU) No 965/2012, Easy Access Rules, Rev. 22, Subpart SPA, SPA.EFB.100 and associated AMC/GM. EASA, Cologne. Available at: https://www.easa.europa.eu/en/document-library/easy-access-rules/easy-access-rules-air-operations (accessed 5 March 2026). PDF↩ #93
EASA, 2025b. Notice of Proposed Amendment 2025-01 (A): Take-off performance parameters and position errors — large aeroplanes. RMT.0741. European Union Aviation Safety Agency, Cologne. Available at: https://www.easa.europa.eu/en/document-library/notices-of-proposed-amendment/npa-2025-01 (accessed 5 March 2026). PDF↩ #27
EASA TCDS A.004, 2024. Type-Certificate Data Sheet A.004, Issue 64: Airbus A330 series. European Union Aviation Safety Agency, Cologne. Available at: https://www.easa.europa.eu/en/document-library/type-certificates/noise/easaa004-airbus-a330 (accessed 5 March 2026). PDF
EASA TCDS A.064, 2025. Type-Certificate Data Sheet A.064, Issue 60: Airbus A318/A319/A320/A321 series. European Union Aviation Safety Agency, Cologne. Available at: https://www.easa.europa.eu/en/document-library/type-certificates/aircraft-cs-25-cs-22-cs-23-cs-vla-cs-lsa/easaa064 (accessed 5 March 2026). PDF
EASA TCDS A.110, 2023. Type-Certificate Data Sheet A.110, Issue 16: Airbus A380 series. European Union Aviation Safety Agency, Cologne. Available at: https://www.easa.europa.eu/en/document-library/type-certificates/noise/easaa110-airbus-a380 (accessed 5 March 2026). PDF
EASA TCDS E.003, 2024. Type-Certificate Data Sheet E.003: CFM International CFM56-5B series engines. European Union Aviation Safety Agency, Cologne. Available at: https://www.easa.europa.eu/en/document-library/type-certificates/engine-cs-e/easae003 (accessed 5 March 2026). PDF
EASA TCDS E.004, 2024. Type-Certificate Data Sheet E.004: CFM International CFM56-7B series engines. European Union Aviation Safety Agency, Cologne. Available at: https://www.easa.europa.eu/en/document-library/type-certificates/engine-cs-e/easae004 (accessed 5 March 2026). PDF
EASA TCDS E.042, 2024. Type-Certificate Data Sheet E.042: Rolls-Royce plc Trent 700 series engines. European Union Aviation Safety Agency, Cologne. Available at: https://www.easa.europa.eu/en/document-library/type-certificates/engine-cs-e/easae042 (accessed 5 March 2026). PDF
EASA TCDS IM.E.026, 2024. Type-Certificate Data Sheet IM.E.026: Engine Alliance GP7200 series engines. European Union Aviation Safety Agency, Cologne. Available at: https://www.easa.europa.eu/en/document-library/type-certificates/engine-cs-e/easaime026 (accessed 5 March 2026). PDF
EASA TCDS IM.E.102, 2024. Type-Certificate Data Sheet IM.E.102: General Electric GEnx series engines. European Union Aviation Safety Agency, Cologne. Available at: https://www.easa.europa.eu/en/document-library/type-certificates/engine-cs-e/easaime102 (accessed 5 March 2026). PDF
Endsley, M.R., 1995. Toward a theory of situation awareness in dynamic systems. Human Factors 37(1), 32–64 https://doi.org/10.1518/001872095779049543. PDF↩ #88
Evans, J.E., Ducot, E.R., 1994. The Integrated Terminal Weather System (ITWS). Lincoln Laboratory Journal 7(2), 449–474. Available at: https://www.ll.mit.edu/sites/default/files/publication/doc/integrated-terminal-weather-system-itws-evans-ja-7203.pdf (accessed 5 March 2026). PDF↩ #1
FAA, 1988. Windshear Training Aid, Vol. 1: Overview / Pilot Guide / Training Program. FAA/NTIS, Washington, DC. Available at: https://www.faa.gov/documentLibrary/media/Advisory_Circular/AC00-54.pdf (accessed 5 March 2026). PDF↩ #8#42
FAA, 1998. Airworthiness Standards: Transport Category Airplanes; Harmonization of Regulations. 63 Federal Register 8,318, 8,320 https://www.govinfo.gov/content/pkg/FR-1998-02-18/html/98-3898.htm. Web↩ #18#74
FAA, 2013. Advisory Circular 25.1302-1: Installed Systems and Equipment for Use by the Flightcrew. Washington, DC. Available at: https://www.faa.gov/documentLibrary/media/Advisory_Circular/AC_25_1302-1.pdf (accessed 5 March 2026). PDF↩ #96#97
FAA, 2014. Advisory Circular 20-181: Airworthiness Approval of Attitude and Heading Reference Systems (AHRS). Washington, DC. Available at: https://www.faa.gov/documentLibrary/media/Advisory_Circular/AC_20-181.pdf (accessed 5 March 2026). PDF↩ #101
FAA, 2018. TSO-C117b: Airborne Windshear Warning and Escape Guidance Systems for Transport Airplanes. Washington, DC. Available at: https://rgl.faa.gov/Regulatory_and_Guidance_Library/rgTSO.nsf/0/8e39a1367f4a1752862582e4004ebb0d/$FILE/TSO-C117b.pdf (accessed 5 March 2026). PDF↩ #76#100
FAA, 2024a. Advisory Circular 120-76E: Authorization for Use of Electronic Flight Bags (EFB). Washington, DC. Available at: https://www.faa.gov/documentLibrary/media/Advisory_Circular/AC_120-76E_FAA_Web.pdf (accessed 5 March 2026). PDF↩ #94
FAA, 2025a. Takeoff speeds, Title 14 C.F.R. §25.107 https://www.ecfr.gov/current/title-14/chapter-I/subchapter-C/part-25/subpart-B/subject-group-ECFR14f0e2fcc647a42/section-25.107. Web↩ #17
FAA, 2025b. Equipment, systems, and installations, Title 14 C.F.R. §25.1309 https://www.ecfr.gov/current/title-14/chapter-I/subchapter-C/part-25/subpart-F/subject-group-ECFR9f24bf451b0d2b1/section-25.1309. Web↩ #92
FAA TCDS A16WE, 2024. Type Certificate Data Sheet A16WE, Rev. 72: Boeing 737 series. Federal Aviation Administration, Washington, DC. Available at: https://drs.faa.gov (accessed 5 March 2026). PDF↩ #44#59
FAA TCDS T00021SE, 2024. Type Certificate Data Sheet T00021SE, Rev. 22: Boeing 787 series. Federal Aviation Administration, Washington, DC. Available at: https://drs.faa.gov (accessed 5 March 2026). PDF↩ #47
Fischer, U., Orasanu, J., Davison, J., 2008. Operational Factors in Pilots’ Risk Assessment and Management. Final Report on NASA Cooperative Agreement NNA04CC84A. Georgia Institute of Technology / NASA Ames Research Center. Available at: https://ntrs.nasa.gov/citations/20080022797 (accessed 5 March 2026). PDF↩ #22#98
Foy, W.H., 1981. Groundspeed/Airspeed Differences as a Wind Shear Indicator and Airborne Application. Report DOT/FAA/RD-81/80, FAA Technical Center, Atlantic City. Available at: https://apps.dtic.mil/sti/tr/pdf/ADA097566.pdf (accessed 5 March 2026). PDF↩ #25
FSF, 2017. Continued Takeoffs. AeroSafety World, Flight Safety Foundation, February. Available at: https://flightsafety.org/asw-issue/aerosafety-world-february-2017/ (accessed 5 March 2026). PDF↩ #35
Fujita, T.T., 1985. The Downburst: Microburst and Macroburst. University of Chicago Press, Chicago. ISBN 978-0-9637188-0-9. PDF↩ #2
Gonzalez, J., Lombaerts, T., 2023. Calculation and analysis of the rejected takeoff speed of a commercial airliner under various environmental conditions. AIAA Regional Student Conference https://doi.org/10.2514/6.2023-71626. PDF↩ #29
Gracey, W., 1980. Measurement of Aircraft Speed and Altitude. NASA Reference Publication 1046, NASA Langley Research Center. Available at: https://ntrs.nasa.gov/citations/19800015804 (accessed 5 March 2026). PDF↩ #13#63#69#72
Grewal, M.S., Weill, L.R., Andrews, A.P., 2001. Global Positioning Systems, Inertial Navigation, and Integration. Wiley, New York https://doi.org/10.1002/0470099720. PDF↩ #62
Hon, K.K., 2020. Predicting low-level wind shear using 200-m-resolution NWP at the Hong Kong International Airport. Journal of Applied Meteorology and Climatology 59(2), 193–206 https://doi.org/10.1175/JAMC-D-19-0186.1. PDF↩ #37#82
Honeywell, 2016. LASEREF VI Micro Inertial Reference System: Product Description. Honeywell Aerospace, Phoenix, AZ. Available at: https://aerospace.honeywell.com/us/en/products-and-services/products/navigation-and-sensors/navigation-systems/laseref-vi-micro-inertial-reference-systems (accessed 5 March 2026). PDF↩ #66#75
Houck, A.W., McIntyre, M.D.W., 1998. Airspeed prediction filter. European Patent EP 0 827 055 B1, filed 17 July 1997, granted 27 February 2002. Assignee: The Boeing Company. Available at: https://patents.google.com/patent/EP0827055B1/en (accessed 5 March 2026). PDF↩ #14#64#70
Hurt, H.H., 1965. Aerodynamics for Naval Aviators. U.S. Navy, Washington, DC. Available at: https://archive.org/details/aerodynamicsforn0000hurt (accessed 5 March 2026). PDF↩ #51
ICAO, 2005. Manual on Low-Level Wind Shear. Doc 9817. International Civil Aviation Organization, Montréal. Available at: https://store.icao.int/en/manual-on-low-level-wind-shear-and-turbulence-doc-9817 (accessed 5 March 2026). PDF↩ #15#20
ICAO, 2018. Manual of Electronic Flight Bags (EFBs). Doc 10020, 2nd ed. ICAO, Montréal. Available at: https://store.icao.int/en/manual-of-electronic-flight-bags-efbs-doc-10020 (accessed 5 March 2026). PDF↩ #95
Jones, M., 2019. TOPI—An Easy Fix to a Nagging Problem. AeroSafety World, Flight Safety Foundation, April. Available at: https://flightsafety.org/asw-article/topi-an-easy-fix-to-a-nagging-problem/ (accessed 5 March 2026). PDF↩ #28
Khattak, A., Zhang, J., Chan, P.W., Chen, F., 2024. Assessment of wind shear severity in airport runway vicinity using interpretable TabNet approach and Doppler LiDAR data. Applied Artificial Intelligence 38(1), 2302227 https://doi.org/10.1080/08839514.2024.2302227. PDF↩ #38
Li, C., Li, Q.S., Xiao, Y.Q., Ou, J.P., 2012. A revised empirical model and CFD simulations for 3D axisymmetric steady-state flows of downbursts and impinging jets. Journal of Wind Engineering and Industrial Aerodynamics 102, 48–60 https://doi.org/10.1016/j.jweia.2011.12.004. PDF
Mantle, P.J., 2016. Induced drag of wings in ground effect. The Aeronautical Journal 120(1234), 1867–1890 https://doi.org/10.1017/aer.2016.106. PDF↩ #48#55#60
McCarthy, J., Serafin, R., Wilson, J.W., Evans, J.E., 2022. Addressing the Microburst Threat to Aviation: Research-to-Operations Success Story. Bulletin of the American Meteorological Society 103(12), E2845–E2864 https://doi.org/10.1175/BAMS-D-22-0038.1. PDF↩ #3
McCarthy, J., Wilson, J.W., Fujita, T.T., 1982. The Joint Airport Weather Studies Project. Bulletin of the American Meteorological Society 63(1), 15–22 https://doi.org/10.1175/1520-0477(1982)063<0015:TJAWSP>2.0.CO;2. PDF↩ #4
Met Office, 2020. Storm Ciara, 9 February 2020. Interesting Events Archive. Met Office, Exeter, UK. Available at: https://www.metoffice.gov.uk/weather/learn-about/past-uk-weather-events PDF
Middleton, D.B., Srivatsan, R., Person, L.H., Jr., 1994. Flight test of takeoff performance monitoring system. NASA Technical Paper 3403, NASA Langley Research Center. Available at: https://ntrs.nasa.gov/citations/19950006251 (accessed 5 March 2026). PDF↩ #26
Miele, A., Wang, T., Melvin, W.W., 1986. Optimal take-off trajectories in the presence of windshear. Journal of Optimization Theory and Applications 49(1), 1–45 https://doi.org/10.1007/BF00939246. PDF↩ #30
NCAR, 2023. Inertial Reference System (IRS) Data Processing. Research Aviation Facility Processing Algorithms, National Center for Atmospheric Research, Boulder, CO https://doi.org/10.26023/zc3gpm25. PDF↩ #67#71
NTSB, 1976. Aircraft accident report: Eastern Air Lines, Inc., Boeing 727-225, N8845E, John F. Kennedy International Airport, Jamaica, New York, June 24, 1975. NTSB, Washington, DC. Available at: https://www.ntsb.gov/investigations/AccidentReports/Reports/AAR7620.pdf (accessed 5 March 2026). PDF↩ #5
NTSB, 1983. Aircraft accident report: Pan American World Airways, Inc., Clipper 759, Boeing 727-235, N4737, New Orleans International Airport, Kenner, Louisiana, July 9, 1982. NTSB, Washington, DC. Available at: https://www.ntsb.gov/investigations/AccidentReports/Reports/AAR8302.pdf (accessed 5 March 2026). PDF↩ #6
NTSB, 1986. Aircraft accident report: Delta Air Lines, Inc., Lockheed L-1011-385-1, N726DA, Dallas/Fort Worth International Airport, Texas, August 2, 1985. NTSB, Washington, DC. Available at: https://www.ntsb.gov/investigations/AccidentReports/Reports/AAR8605.pdf (accessed 5 March 2026). PDF↩ #7
Orasanu, J., Davison, J., 2001. The role of risk in aviation decision making: how pilots perceive and manage flight risks. Proceedings of the Human Factors and Ergonomics Society Annual Meeting 45 (2), 58–62 https://doi.org/10.1177/154193120104500213. PDF↩ #23#89#99
Oseguera, R.M., Bowles, R.L., 1988. A Simple, Analytic 3-Dimensional Downburst Model Based on Boundary Layer Stagnation Flow. NASA TM-100632, NASA Langley Research Center. Available at: https://ntrs.nasa.gov/api/citations/19880018674/downloads/19880018674.pdf (accessed 5 March 2026). PDF↩ #78
Phillips, W.F., Hunsaker, D.F., 2013. Lifting-line predictions for induced drag and lift in ground effect. Journal of Aircraft 50(4), 1226–1233 https://doi.org/10.2514/1.C032152. PDF↩ #49
Proctor, F.H., Hinton, D.A., Bowles, R.L., 2000. A windshear hazard index. Preprints, 9th Conference on Aviation, Range, and Aerospace Meteorology, American Meteorological Society, Orlando, pp. 482–487. Available at: https://ntrs.nasa.gov/api/citations/20000116199/downloads/20000116199.pdf (accessed 5 March 2026). PDF↩ #24#79
Raymer, D.P., 2018. Aircraft Design: A Conceptual Approach, 6th ed. AIAA Education Series, Reston, VA https://doi.org/10.2514/4.104909. PDF↩ #50#56#61
Romanic, D., Taszarek, M., Brooks, H.E., 2022. Convective environments leading to microburst, macroburst and downburst events across the United States. Weather and Climate Extremes 37, 100474 https://doi.org/10.1016/j.wace.2022.100474. PDF↩ #9
Stratton, D.A., Stengel, R.F., 1995. Real-time decision aiding: aircraft guidance for wind shear avoidance. IEEE Transactions on Aerospace and Electronic Systems 31(1), 184–193 https://doi.org/10.1109/7.366296. PDF↩ #31
Thommen, 2016. AC32 Air Data Computer Installation Manual. Document AC-INST-500, Rev. 2.5. Thommen Aircraft Equipment AG, Waldenburg, Switzerland. Available at: https://thommen.aero (accessed 5 March 2026). PDF↩ #65
U.S. DoD, 2020. Global Positioning System Standard Positioning Service Performance Standard, 5th ed. Department of Defense, Washington, DC. Available at: https://www.navcen.uscg.gov/sites/default/files/pdf/gps/geninfo/2020SPSPerformanceStandardFINAL.pdf (accessed 5 March 2026). PDF↩ #68
van Es, G.W.H., 2010. Rejecting a takeoff after V1—why does it (still) happen? NLR-TP-2010-177, Netherlands Aerospace Centre, Amsterdam. Available at: https://reports.nlr.nl/handle/10921/158 (accessed 5 March 2026). PDF↩ #40
Vicroy, D.D., 1992. Assessment of Microburst Models for Downdraft Estimation. Journal of Aircraft 29(6), 1043–1048 https://doi.org/10.2514/3.46285. PDF↩ #80
Wickens, C.D., 2002. Situation awareness and workload in aviation. Current Directions in Psychological Science 11(4), 128–133 https://doi.org/10.1111/1467-8721.00184. PDF↩ #43
Zhang, H., Wu, S., Wang, Q., Liu, B., Yin, B., Zhai, X., 2022. LiDAR-based windshear detection via statistical features. Advances in Meteorology 2022, 3039797 https://doi.org/10.1155/2022/3039797. PDF↩ #39
Zweifel, T.J., 1988. The effect of windshear during takeoff roll on aircraft stopping distance. NASA. Available at: https://ntrs.nasa.gov/citations/19910002386 (accessed 5 March 2026). PDF↩ #21#32